eve_phone.wav
Matt Montag - EEN 540 Speech Signal Processing - Project 1
phonemes.zip - zip archive of all words, segmented phonemes, and channel filtered words
Click the phonemes to toggle the detail view. Please note there are 10 MB of images and they may take a while to load.
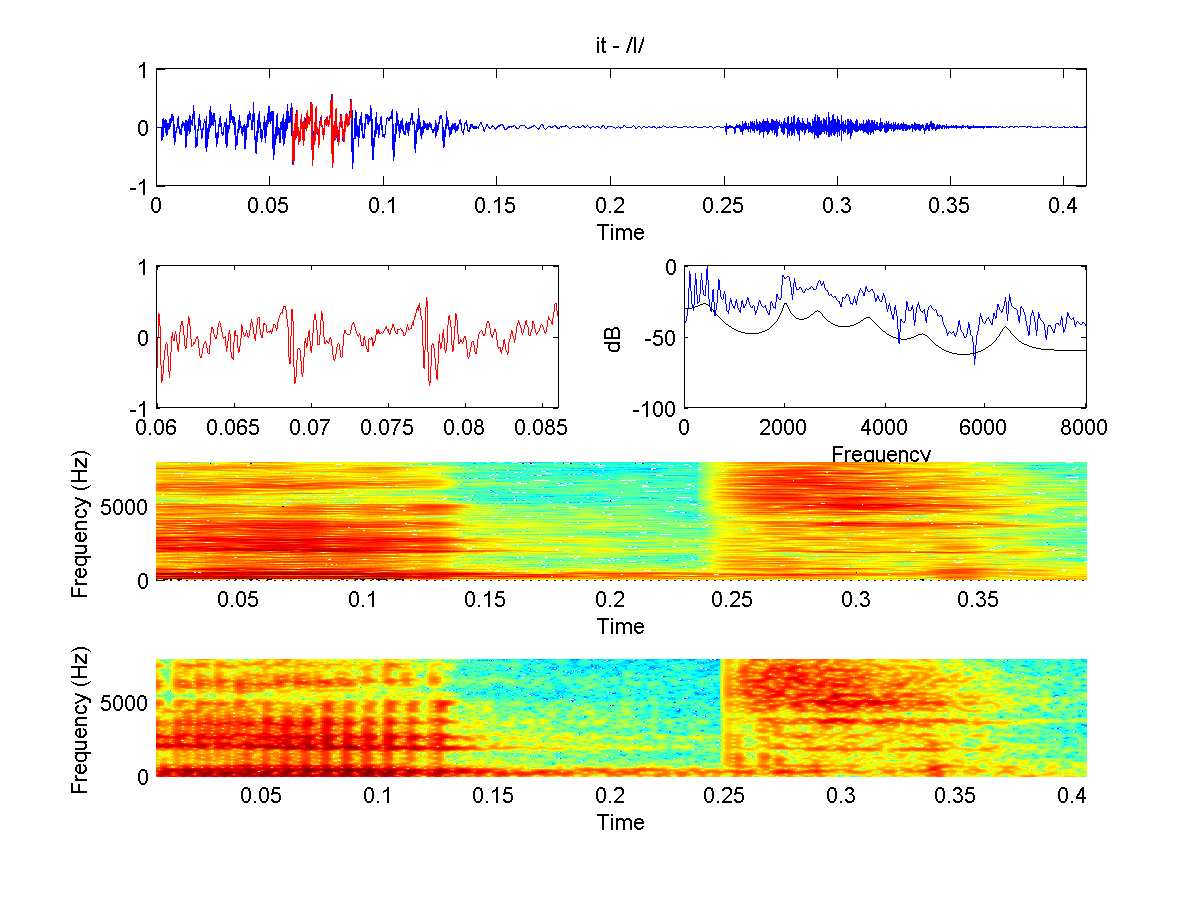
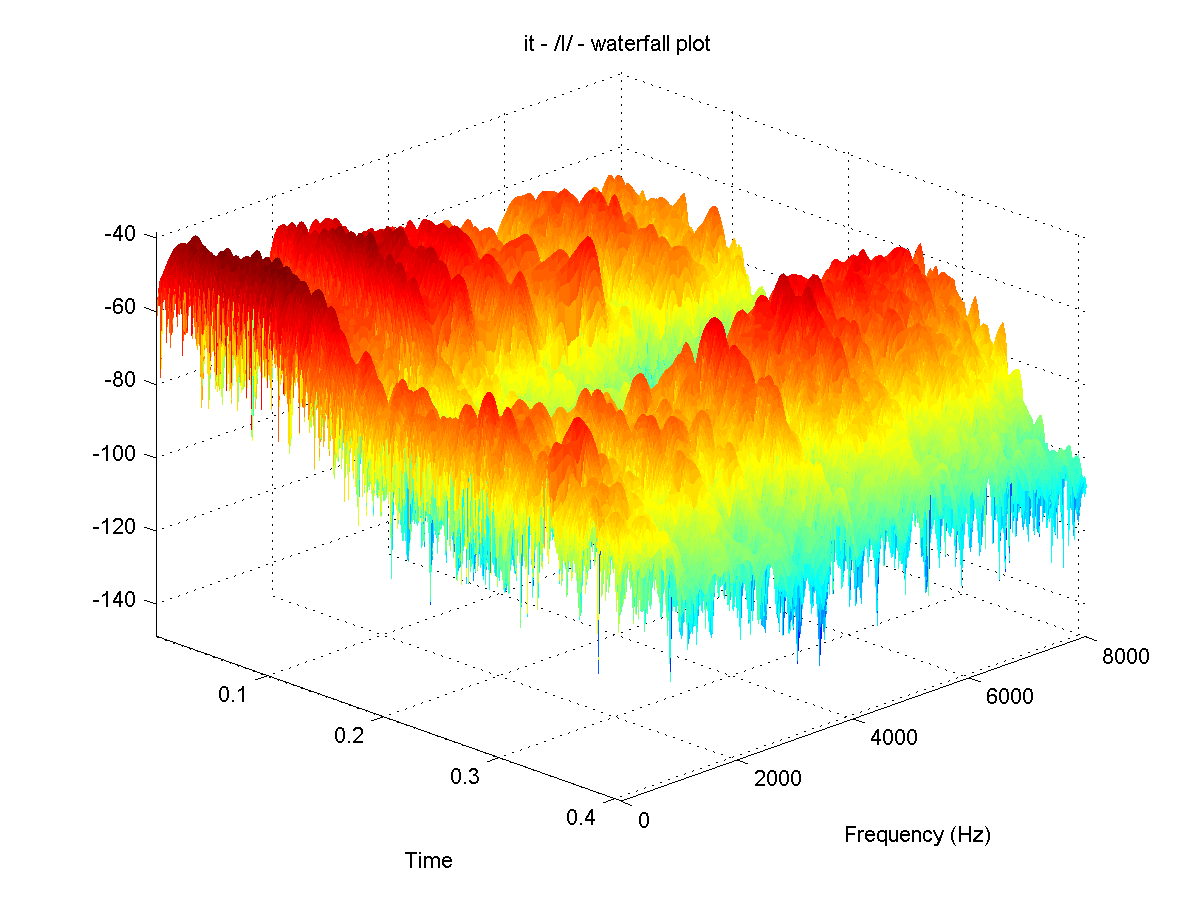
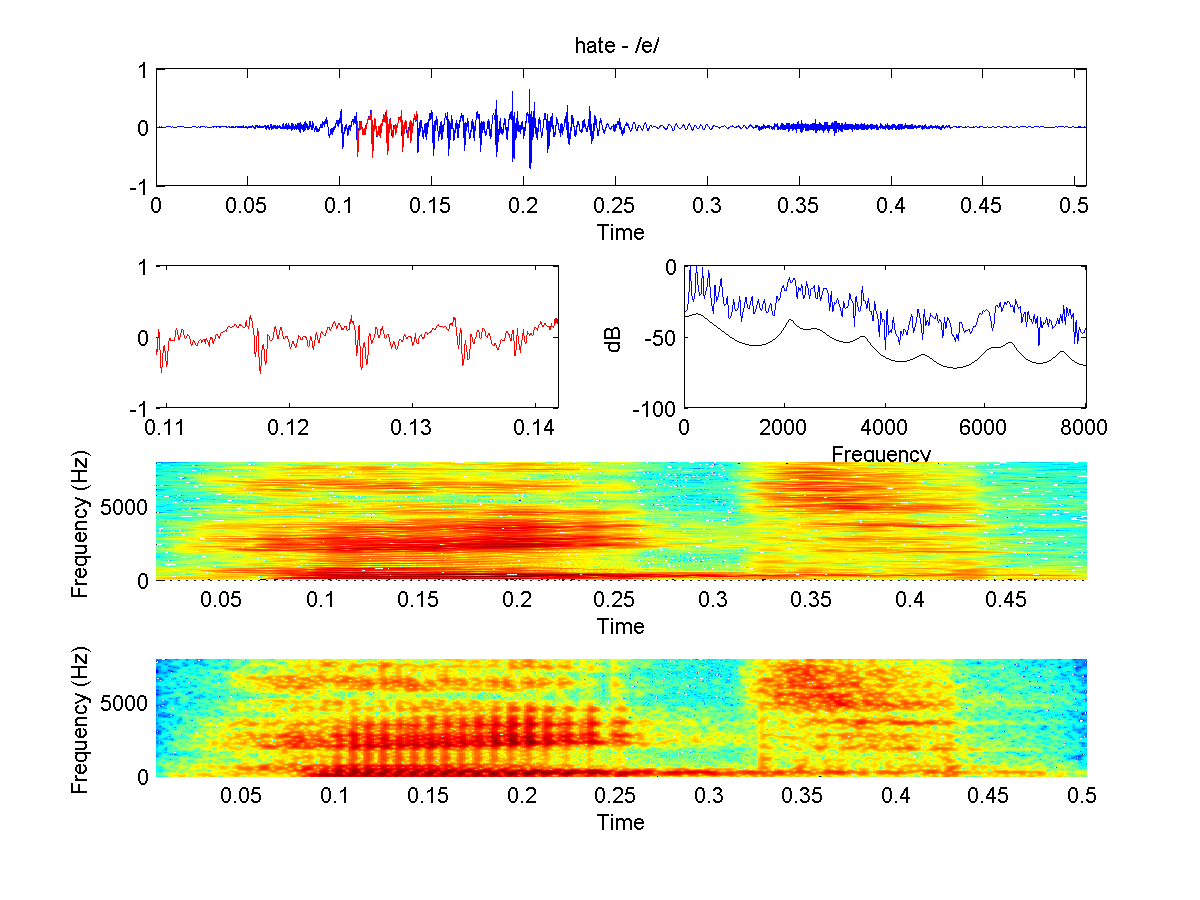
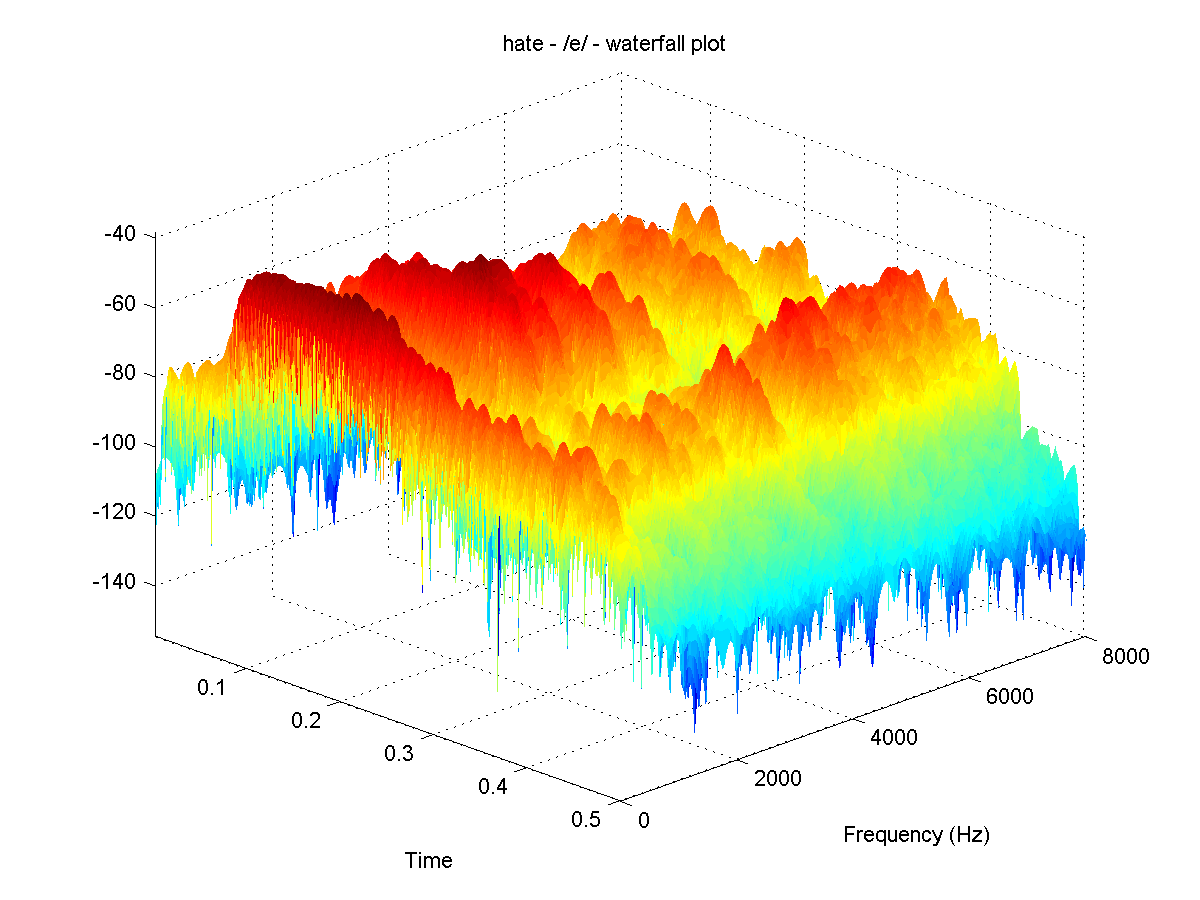
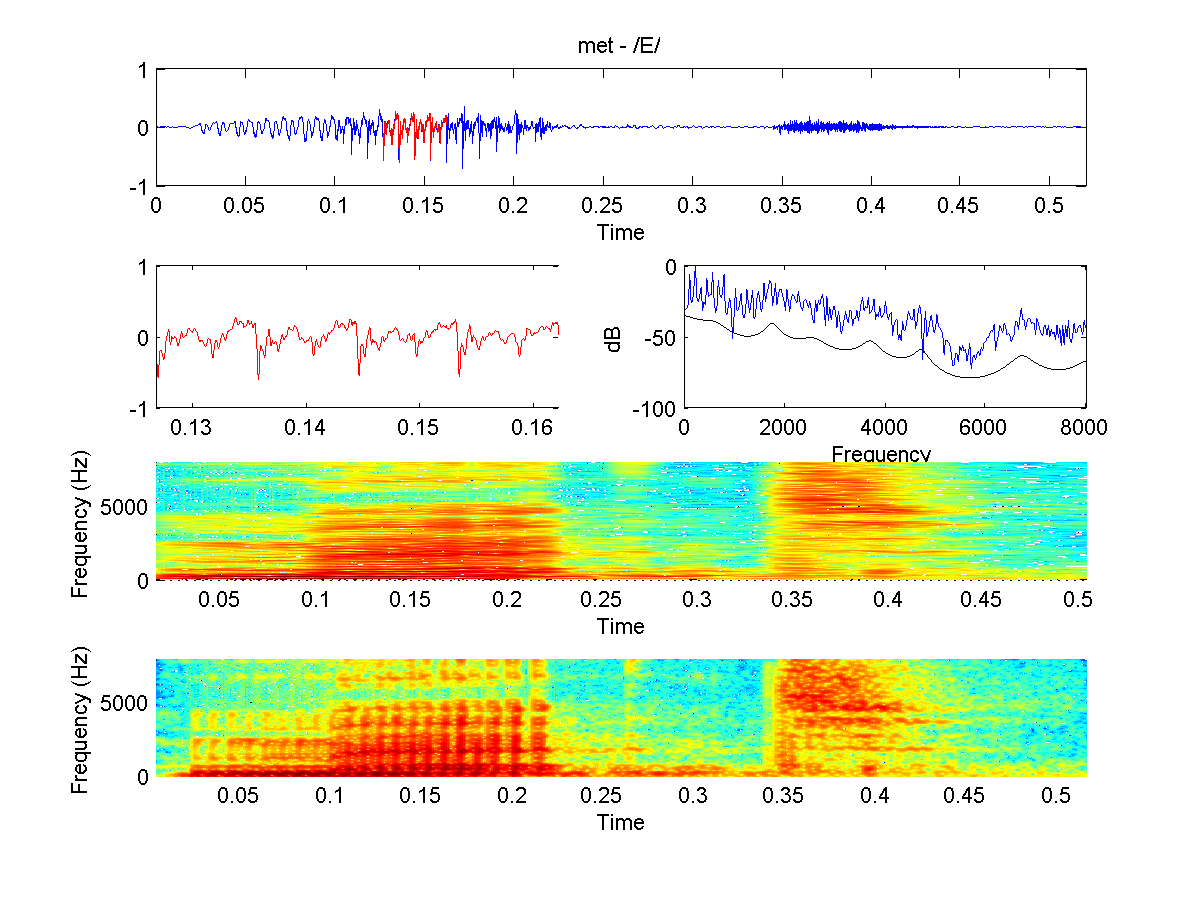
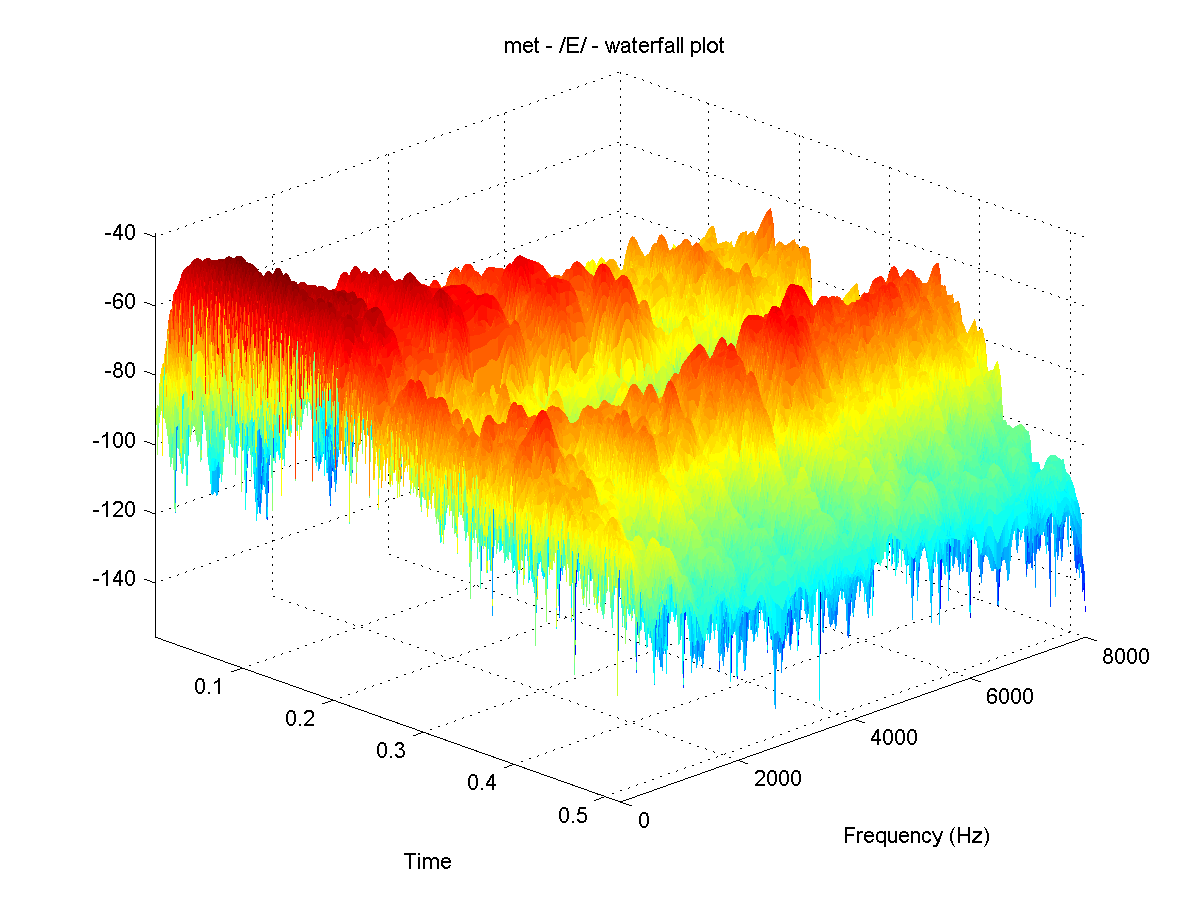
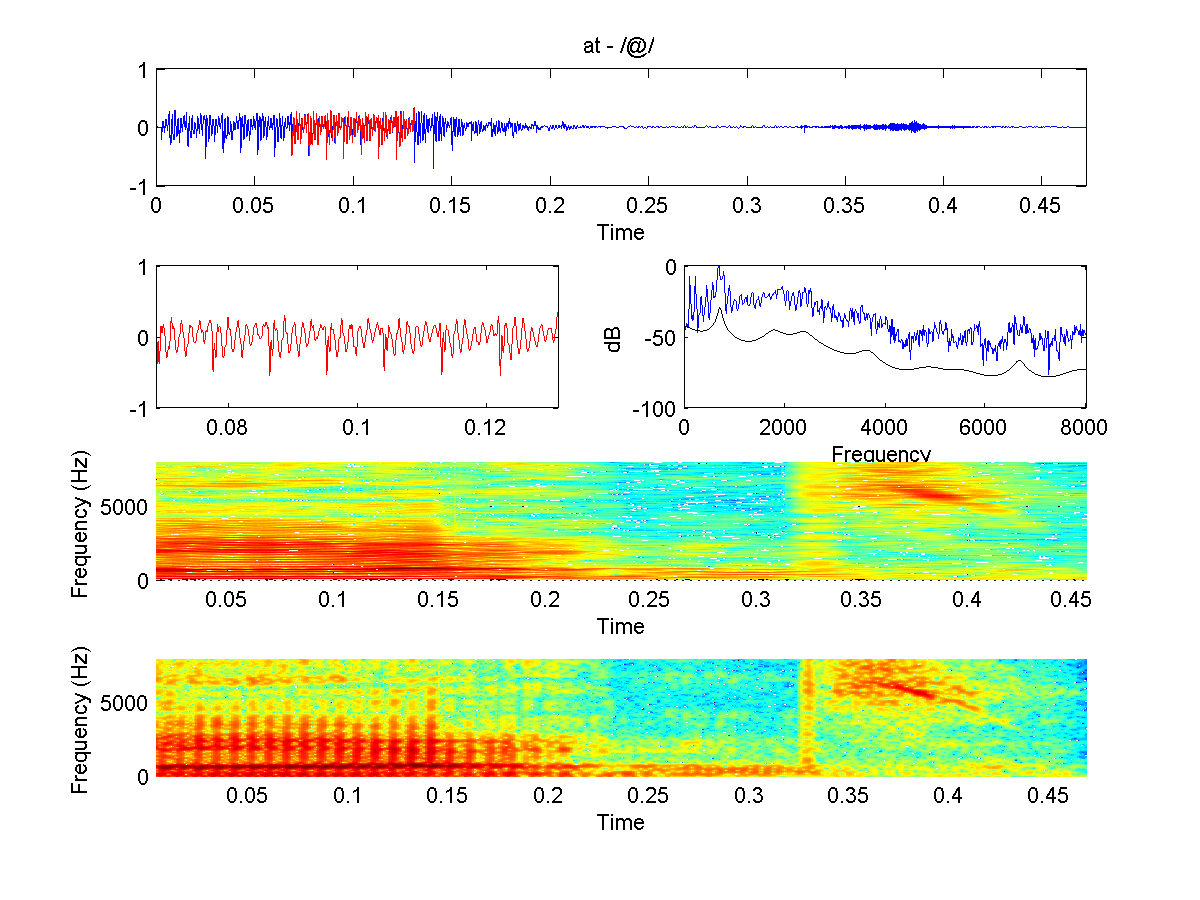
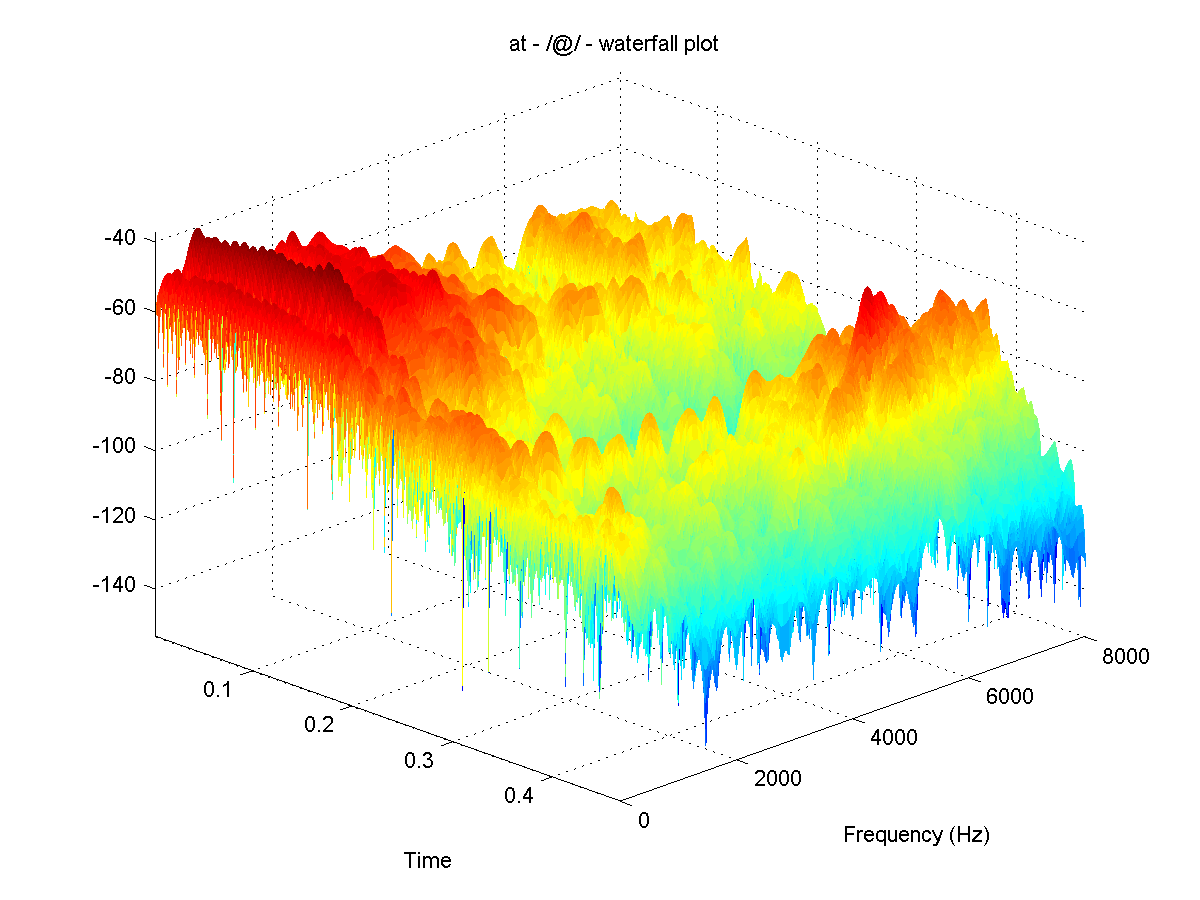
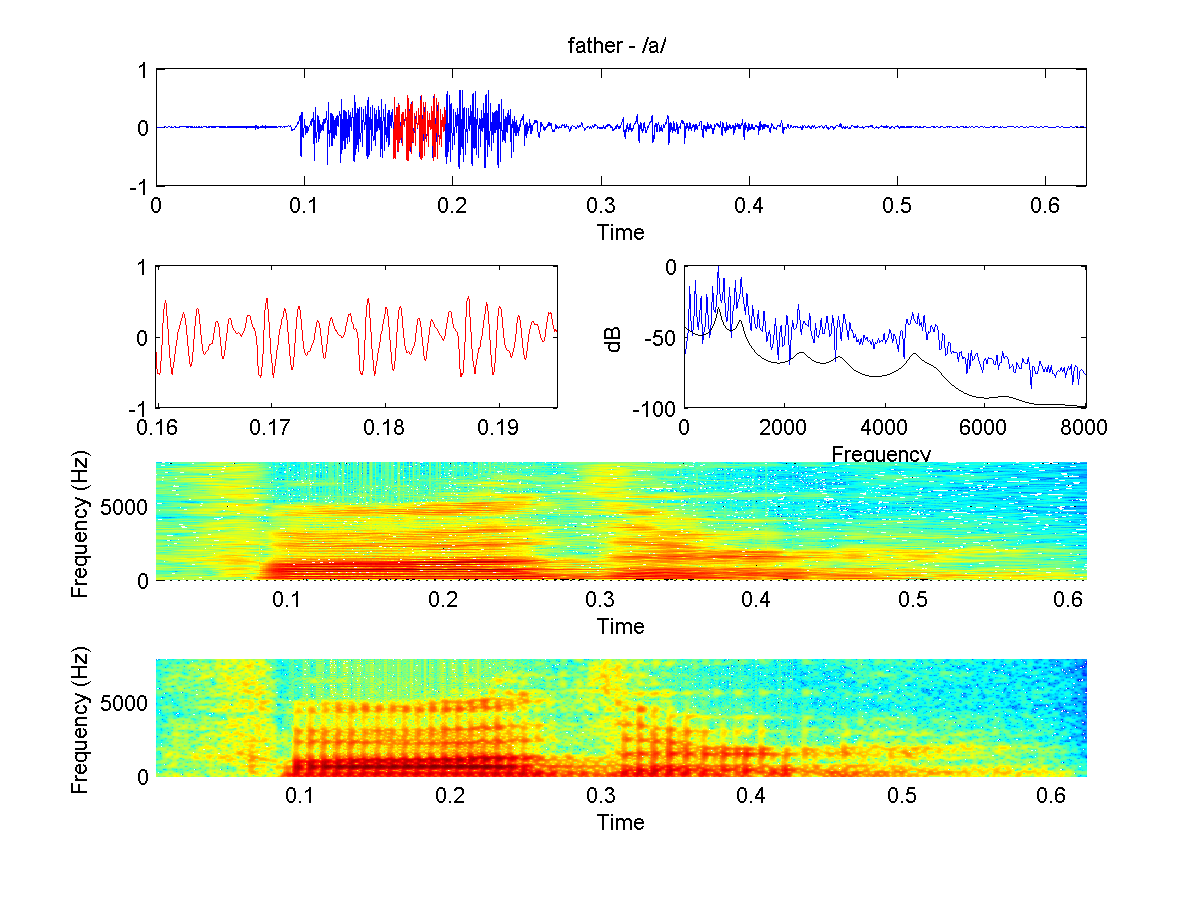
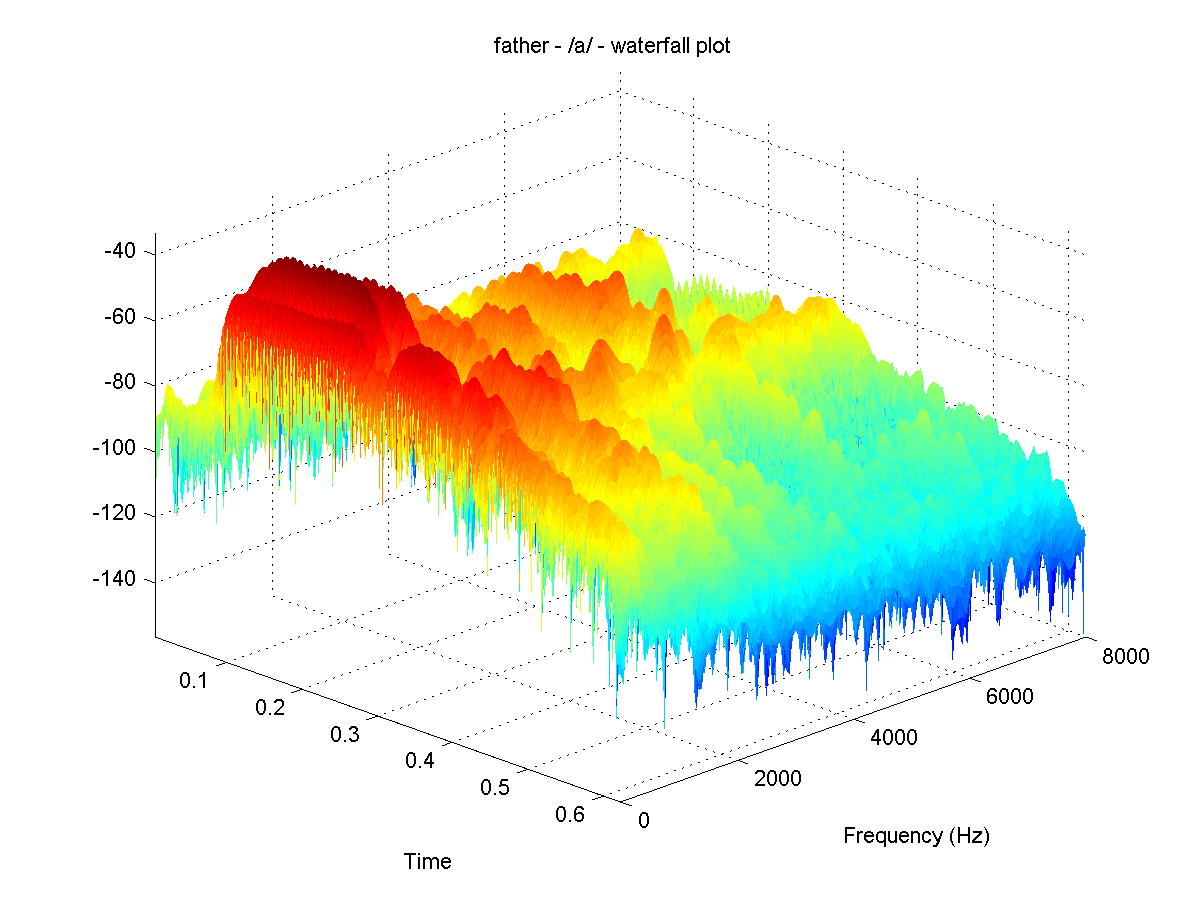
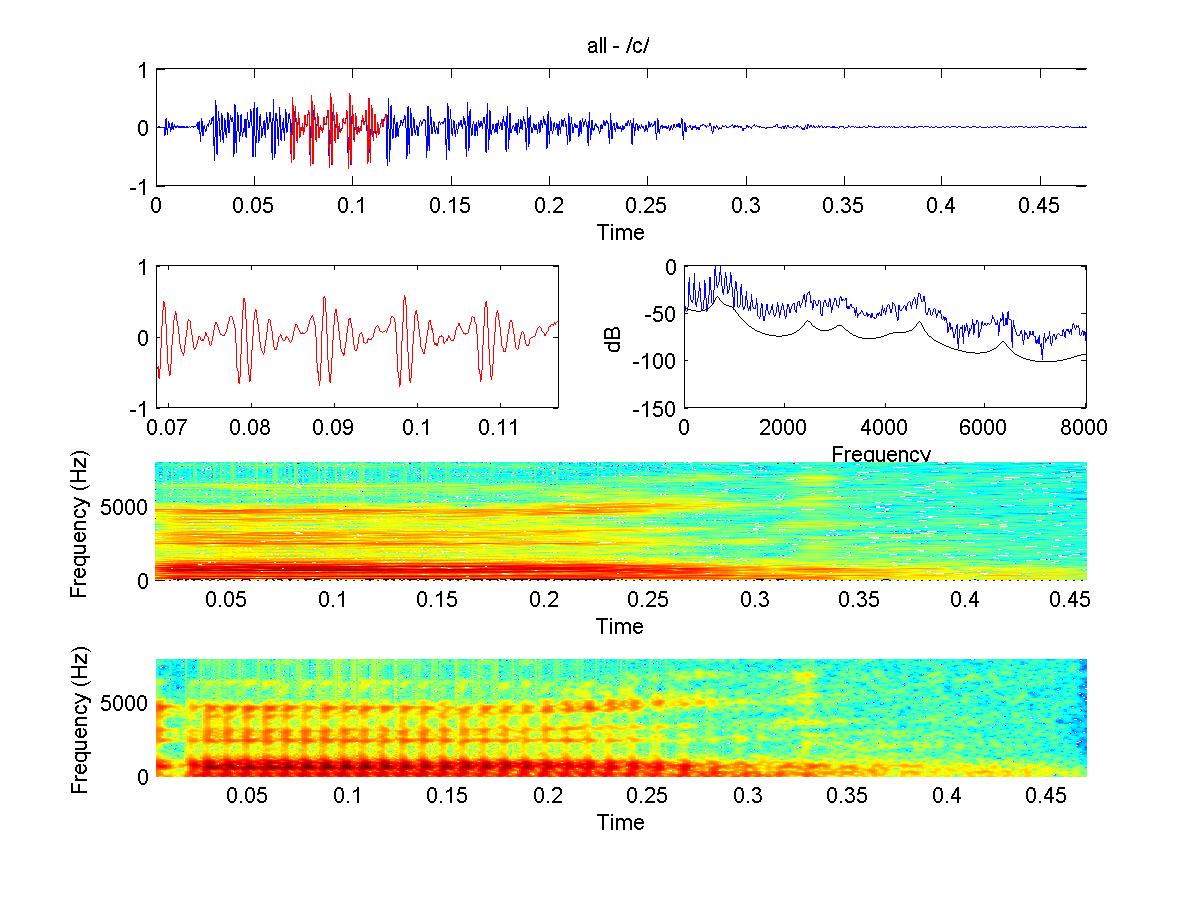
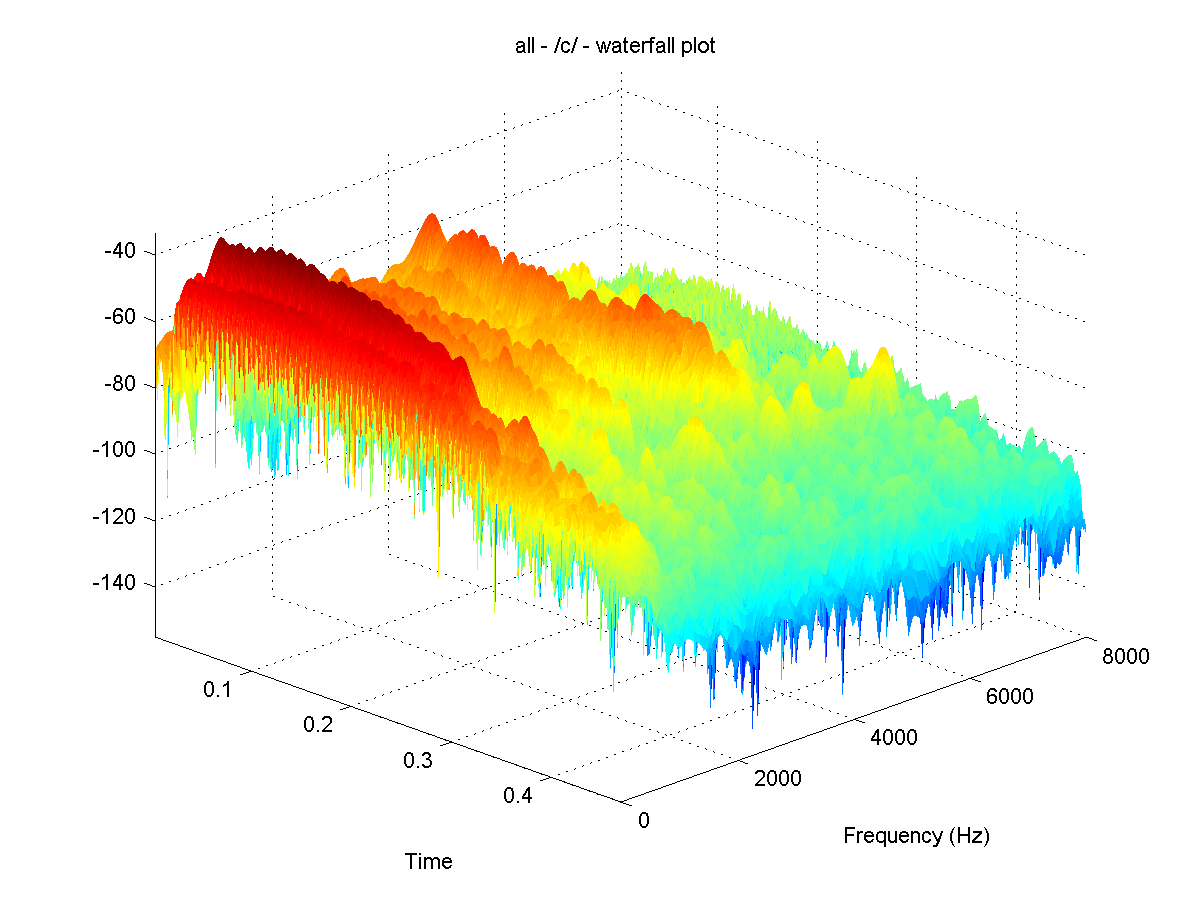
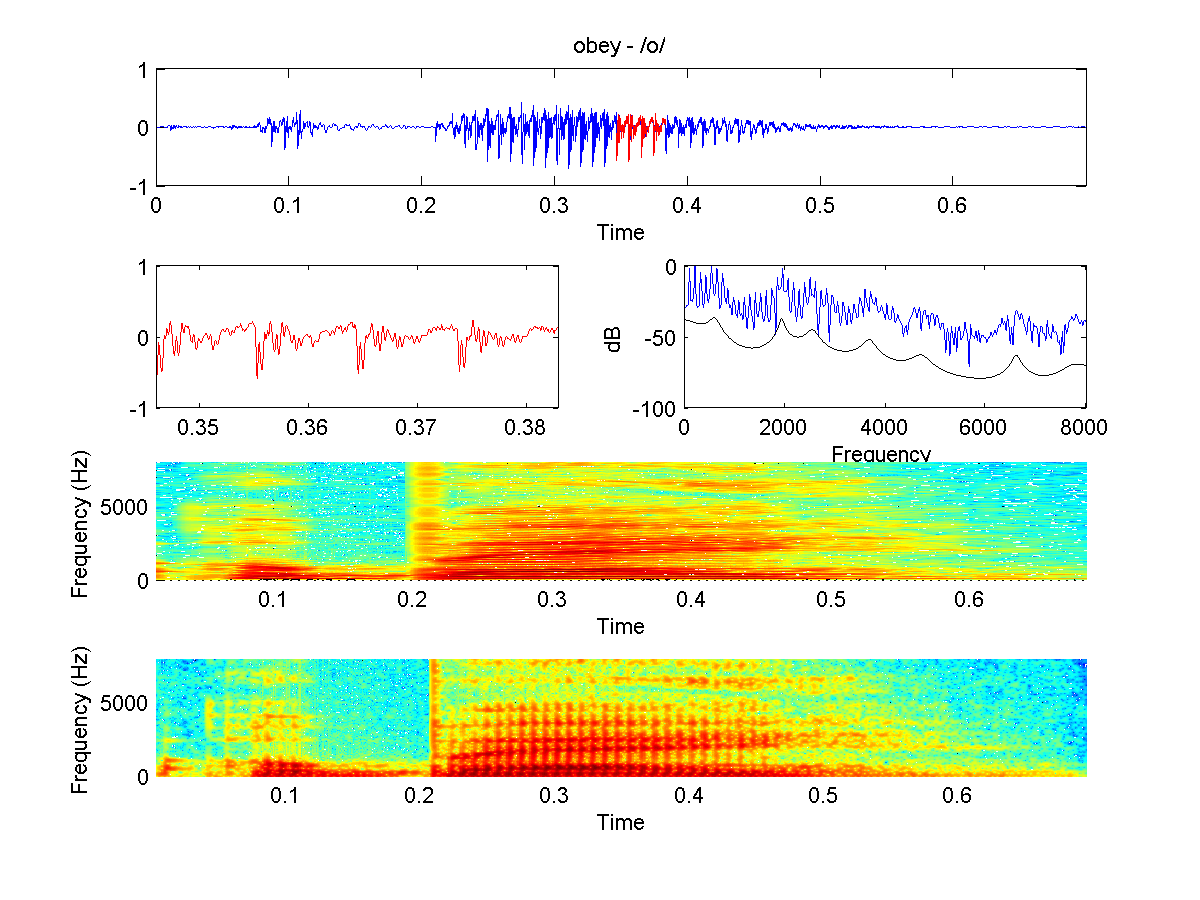
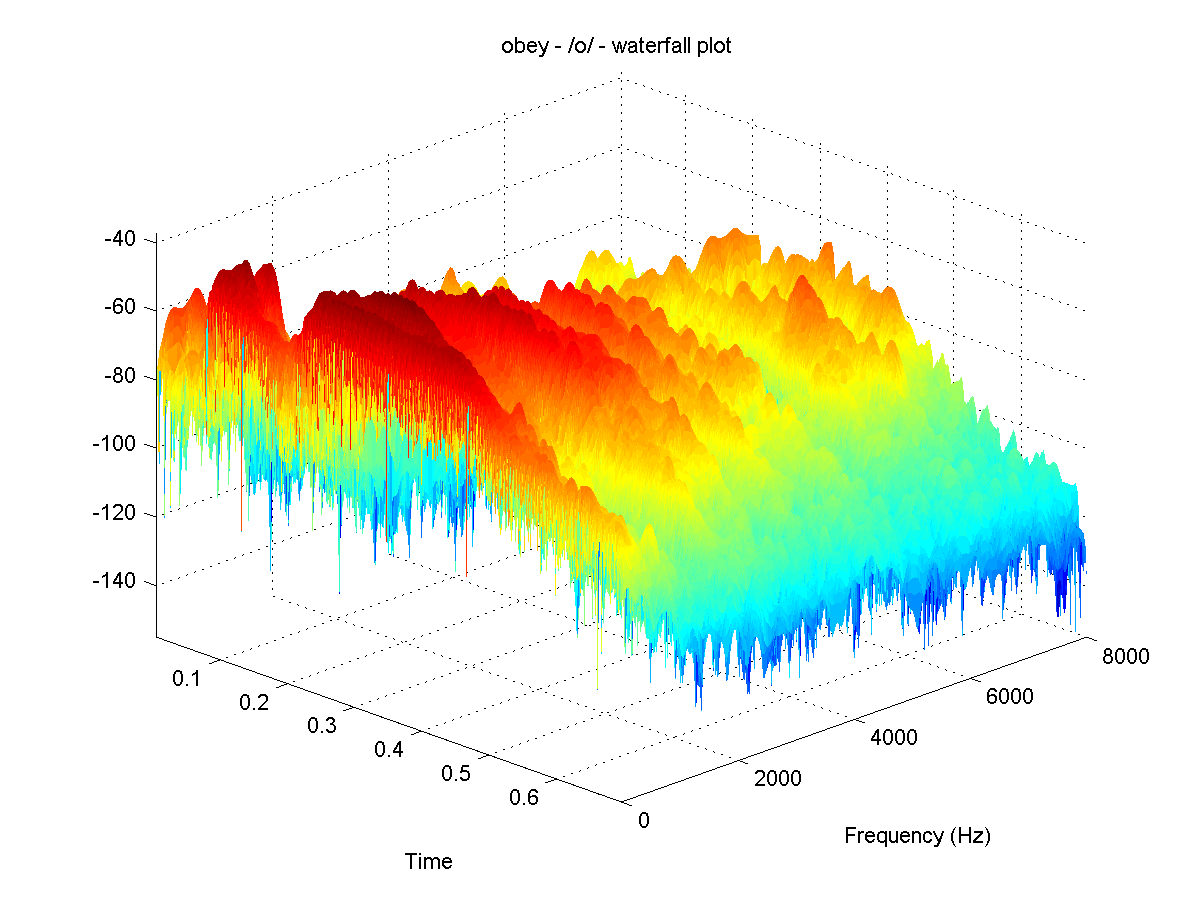
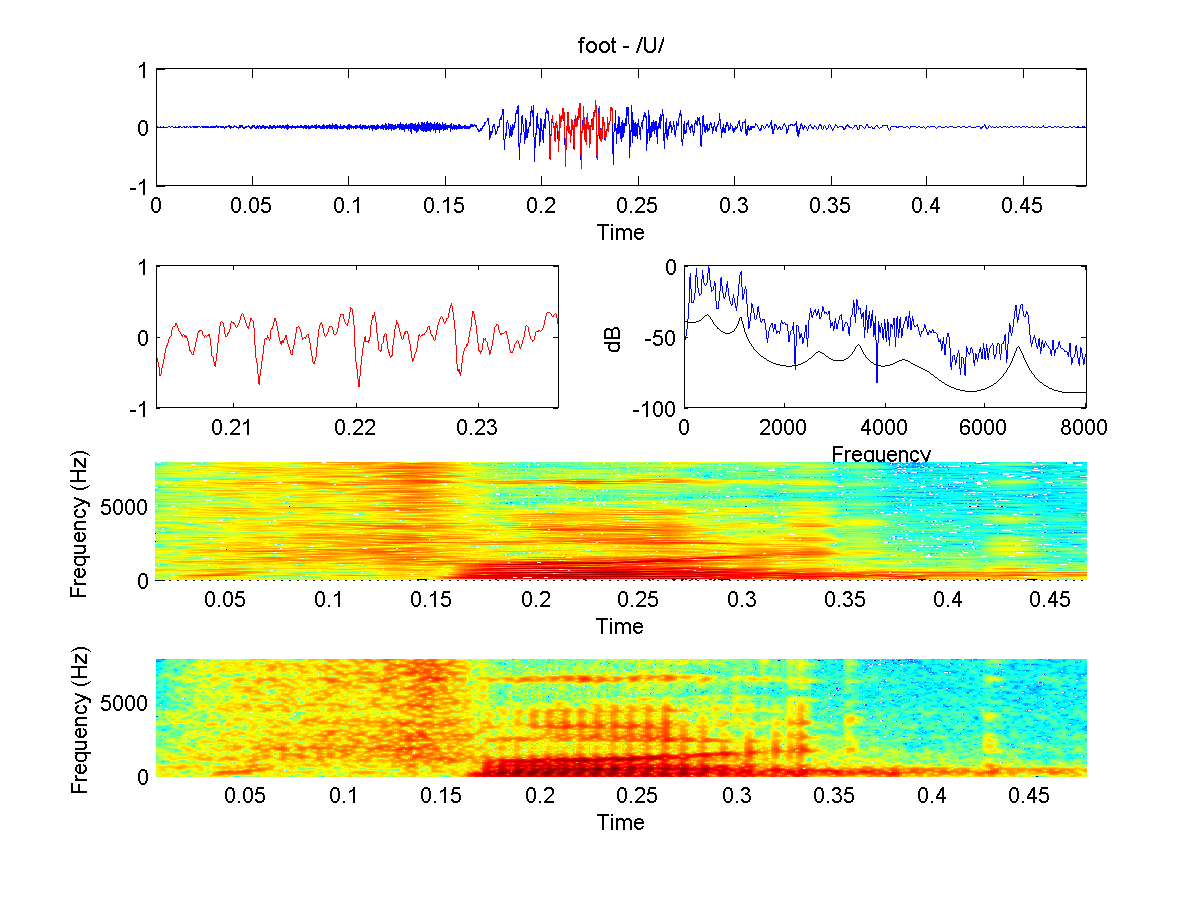
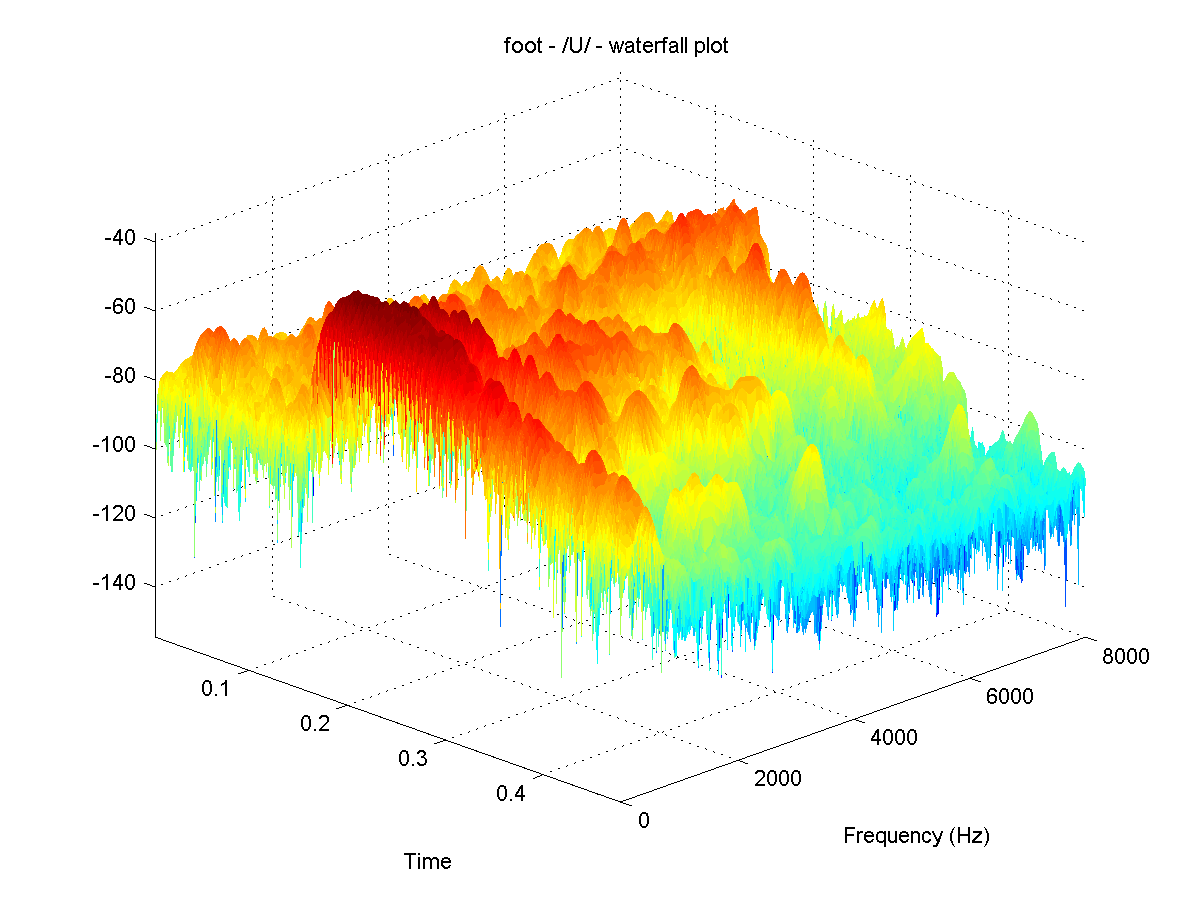
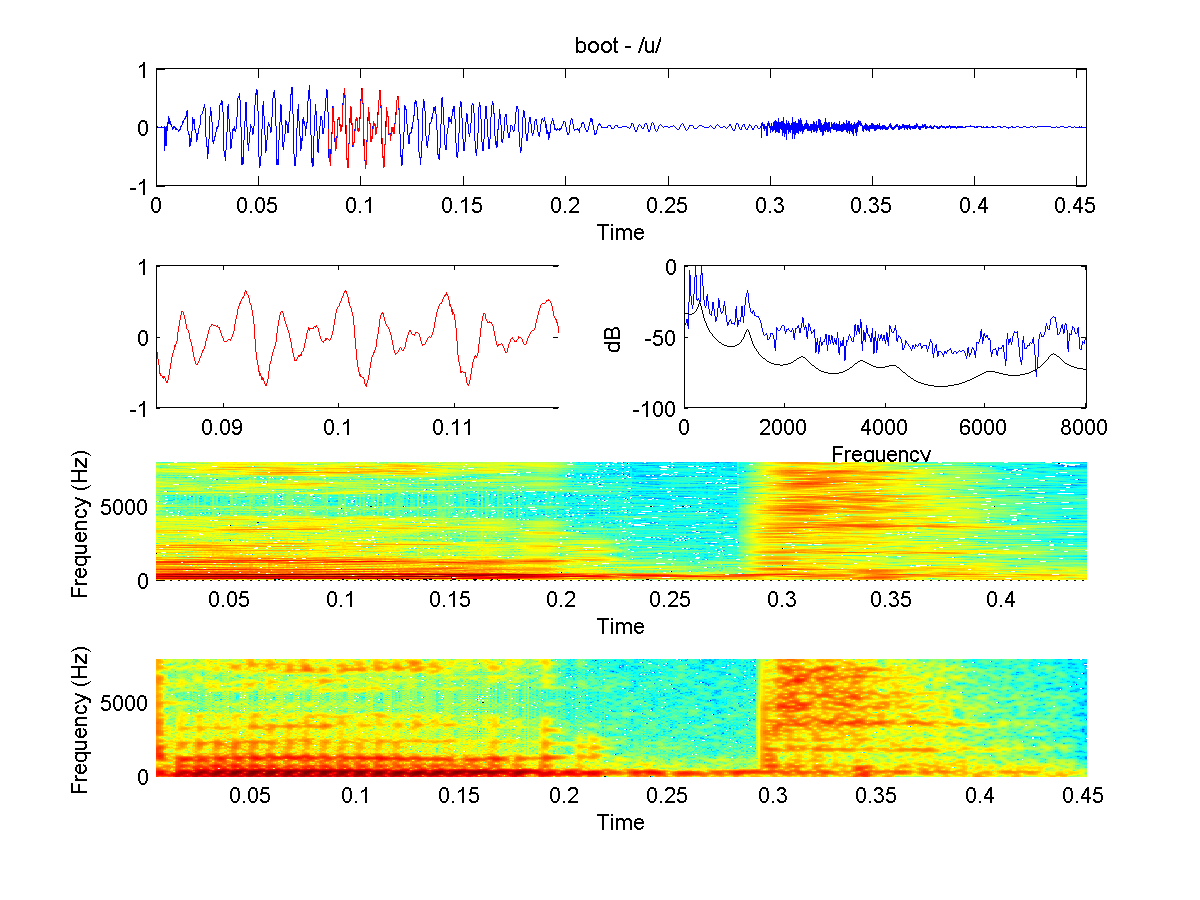
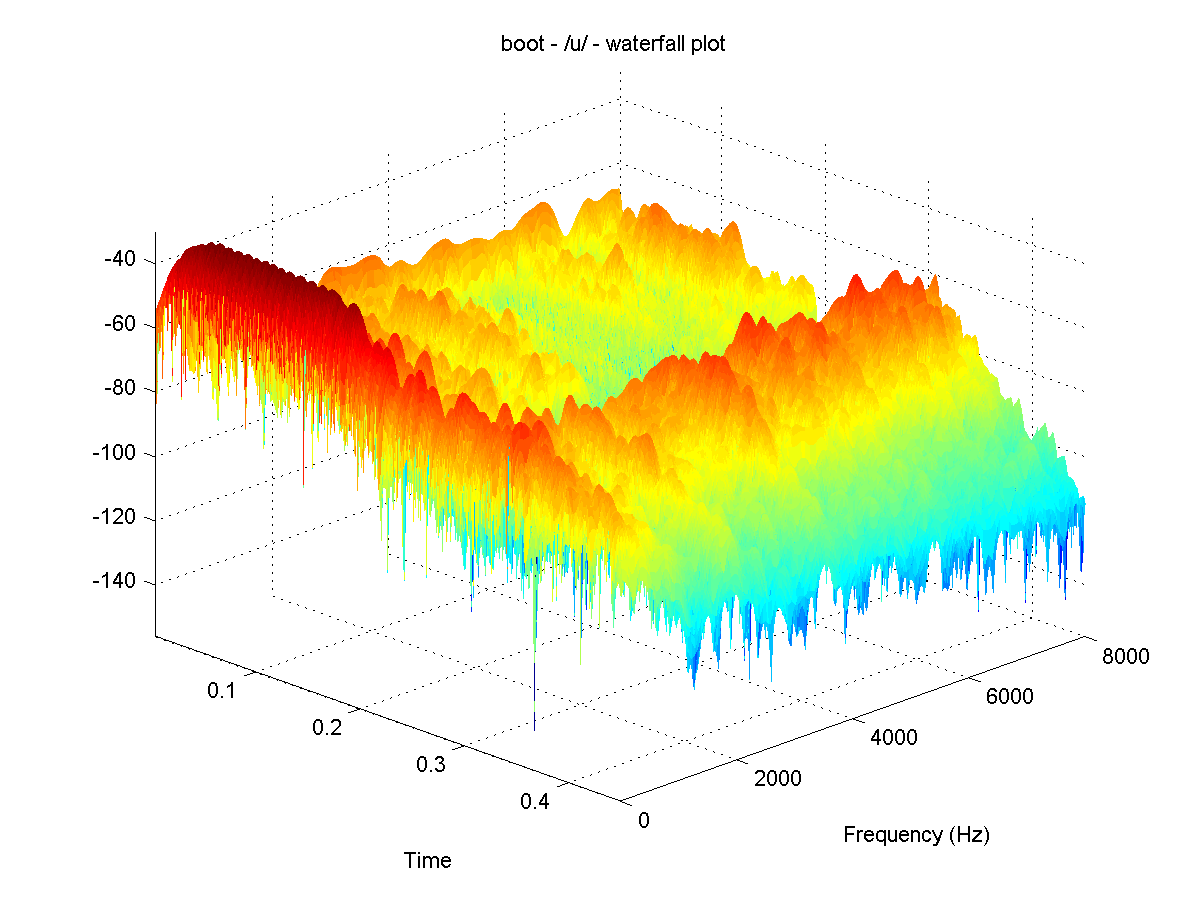
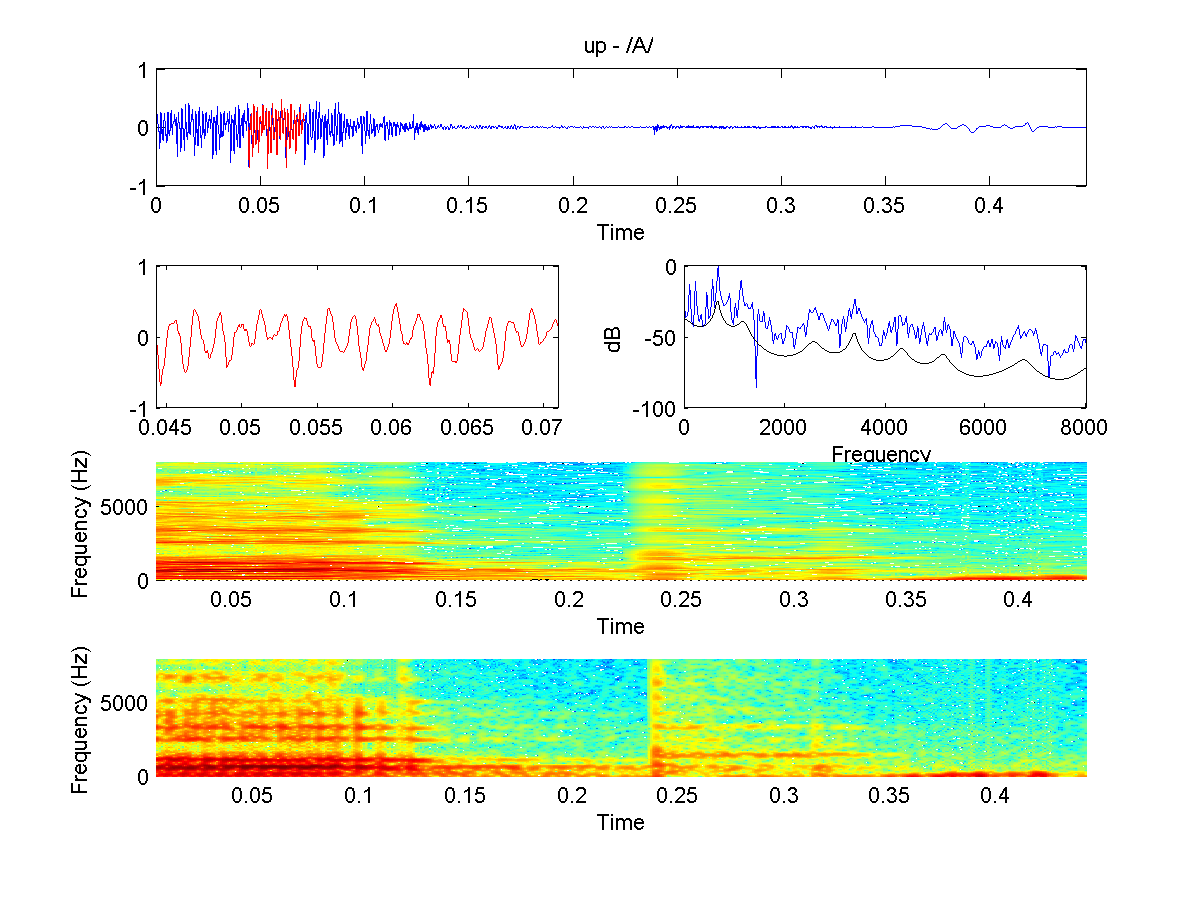
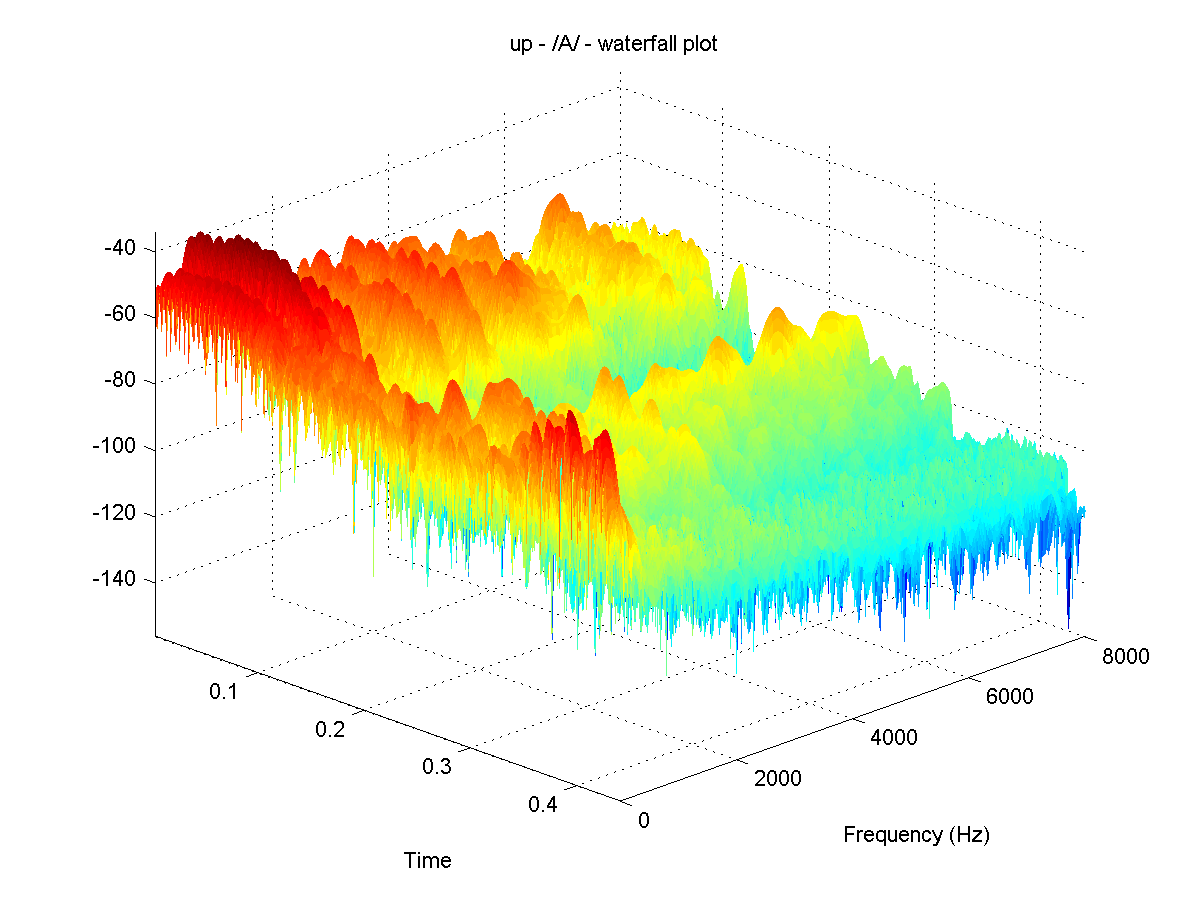
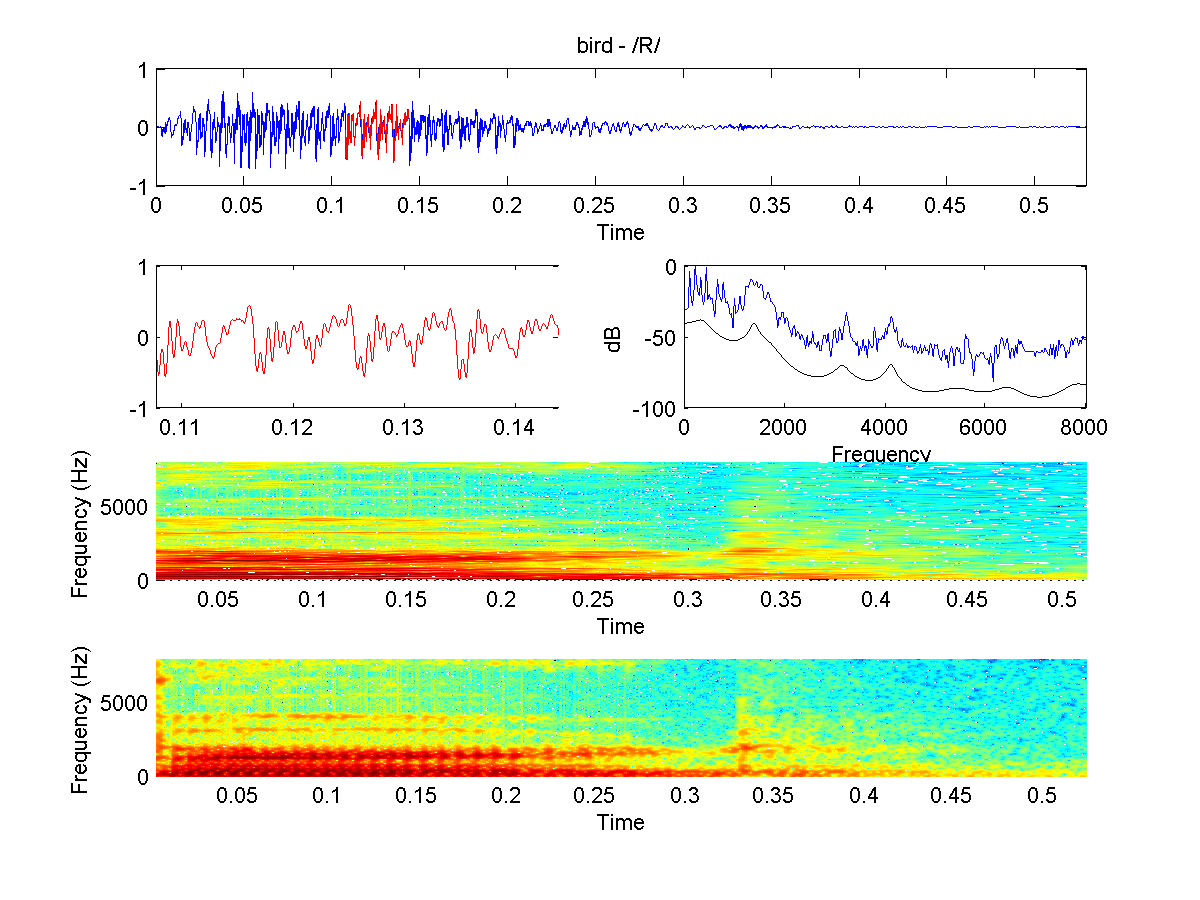
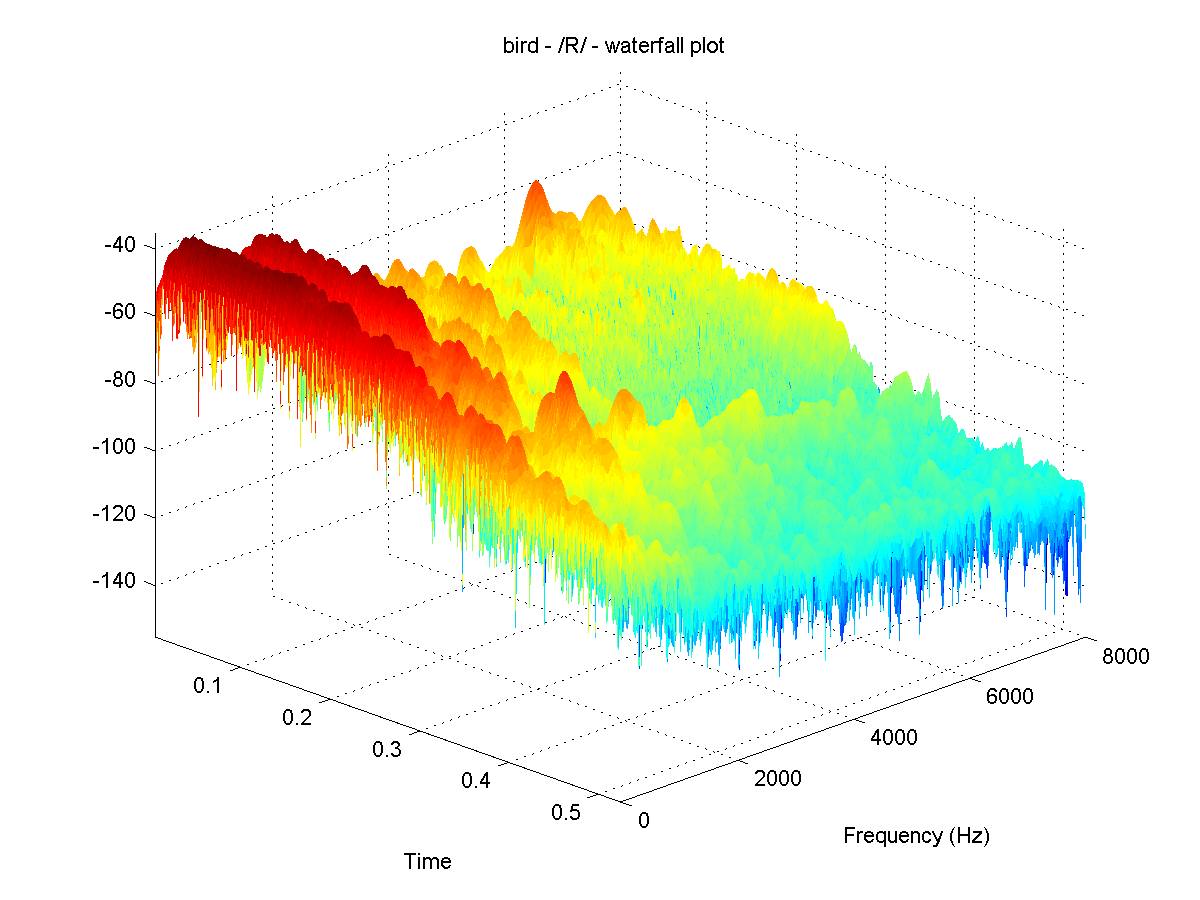
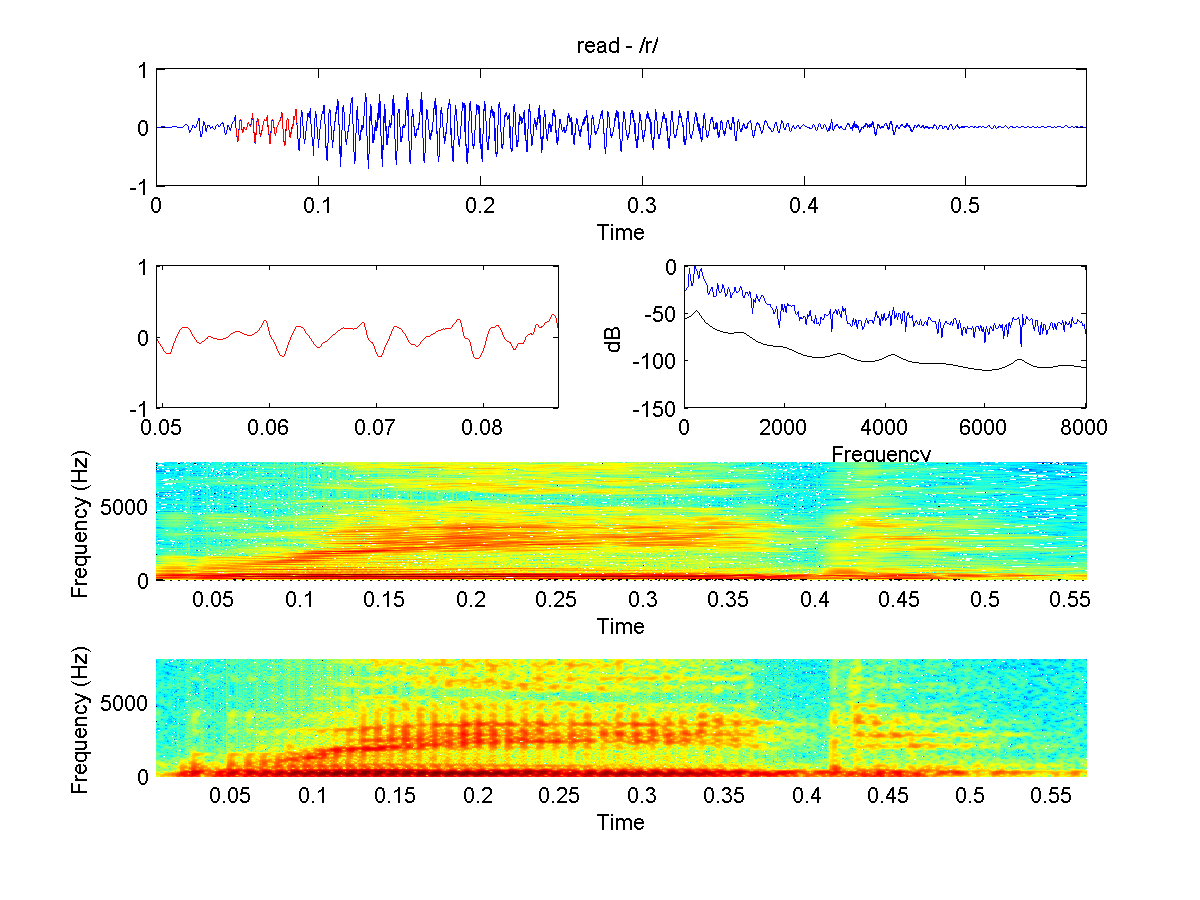
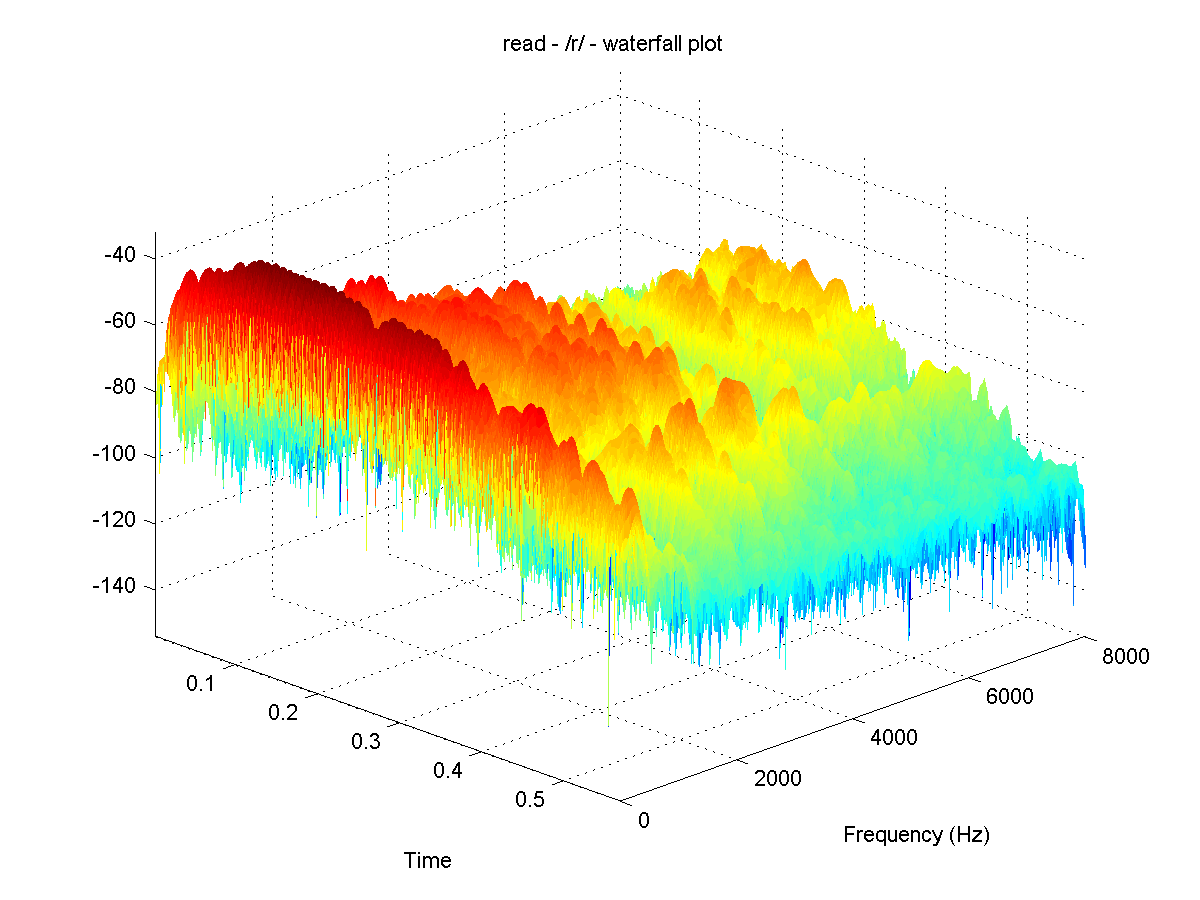
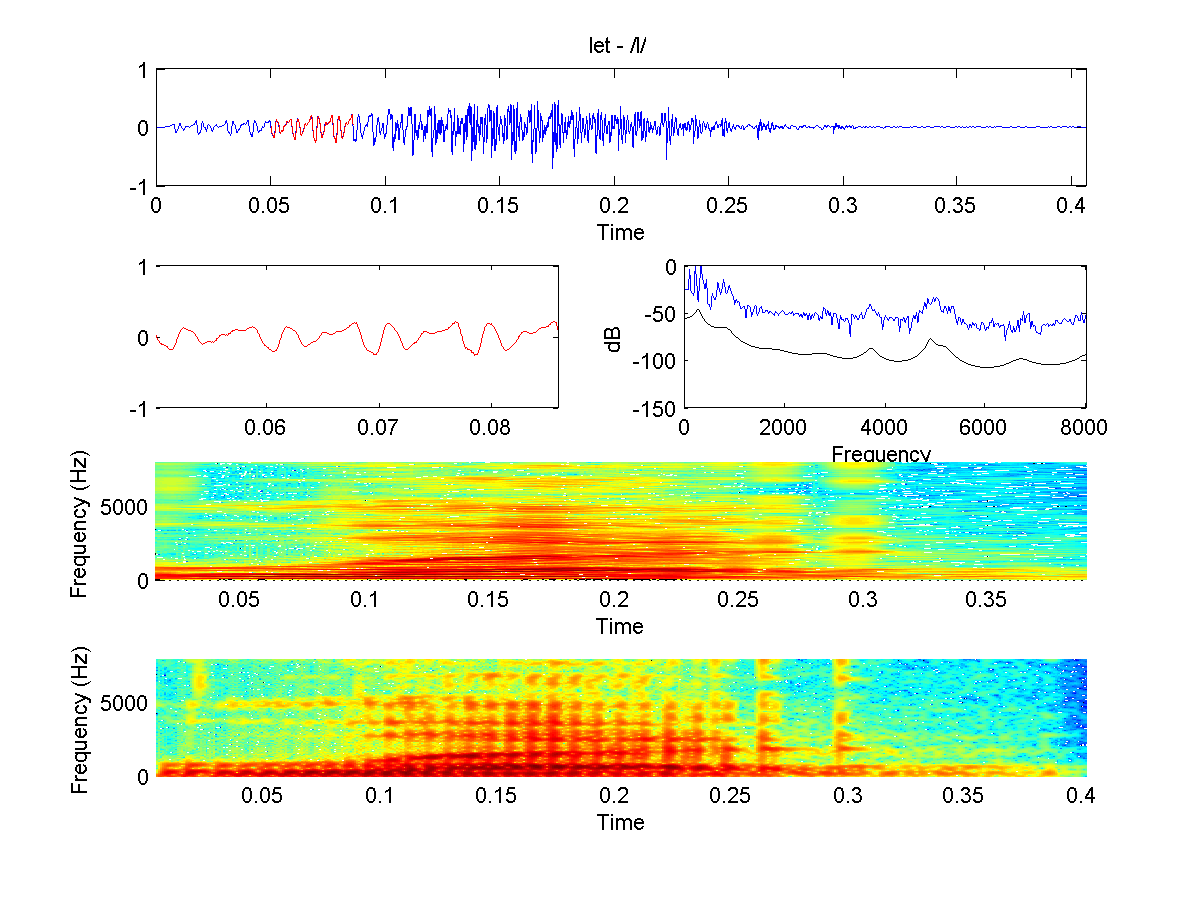
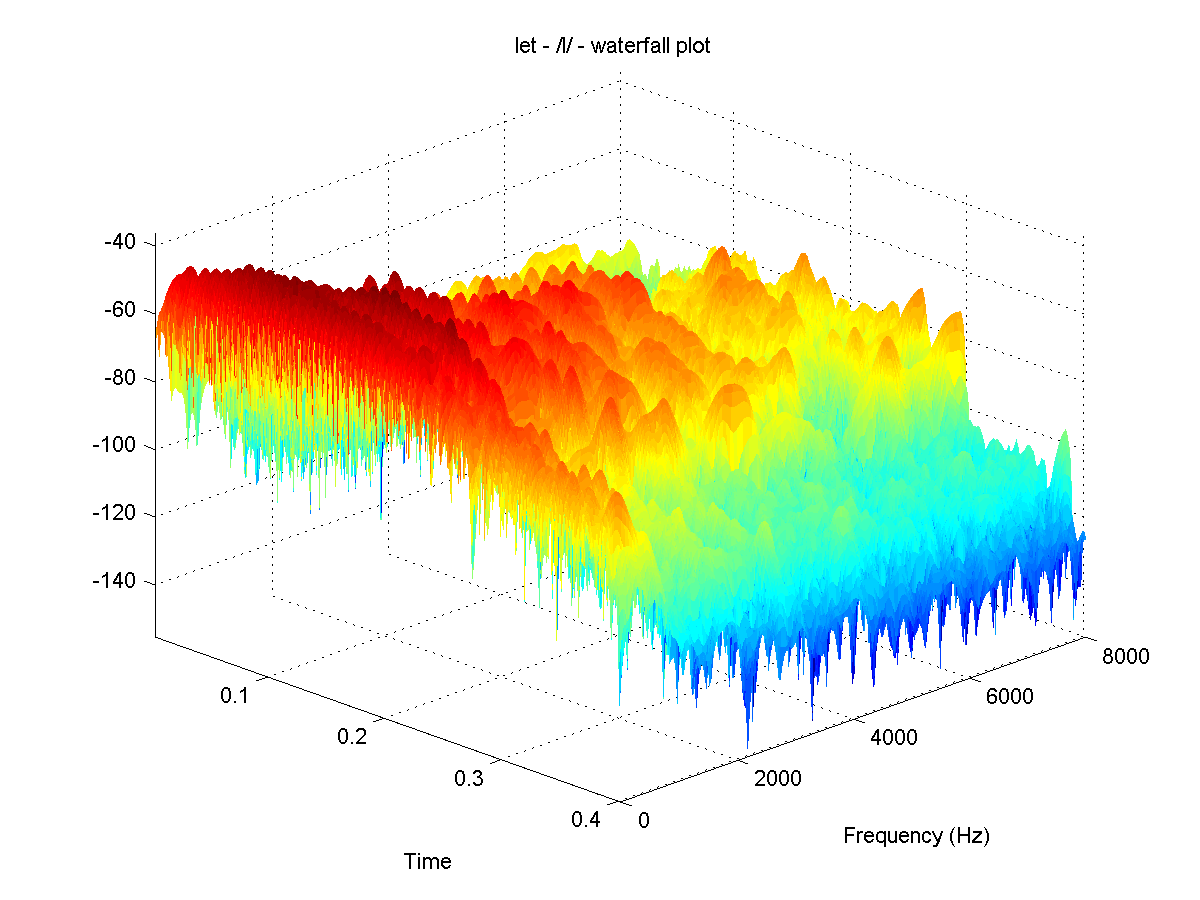
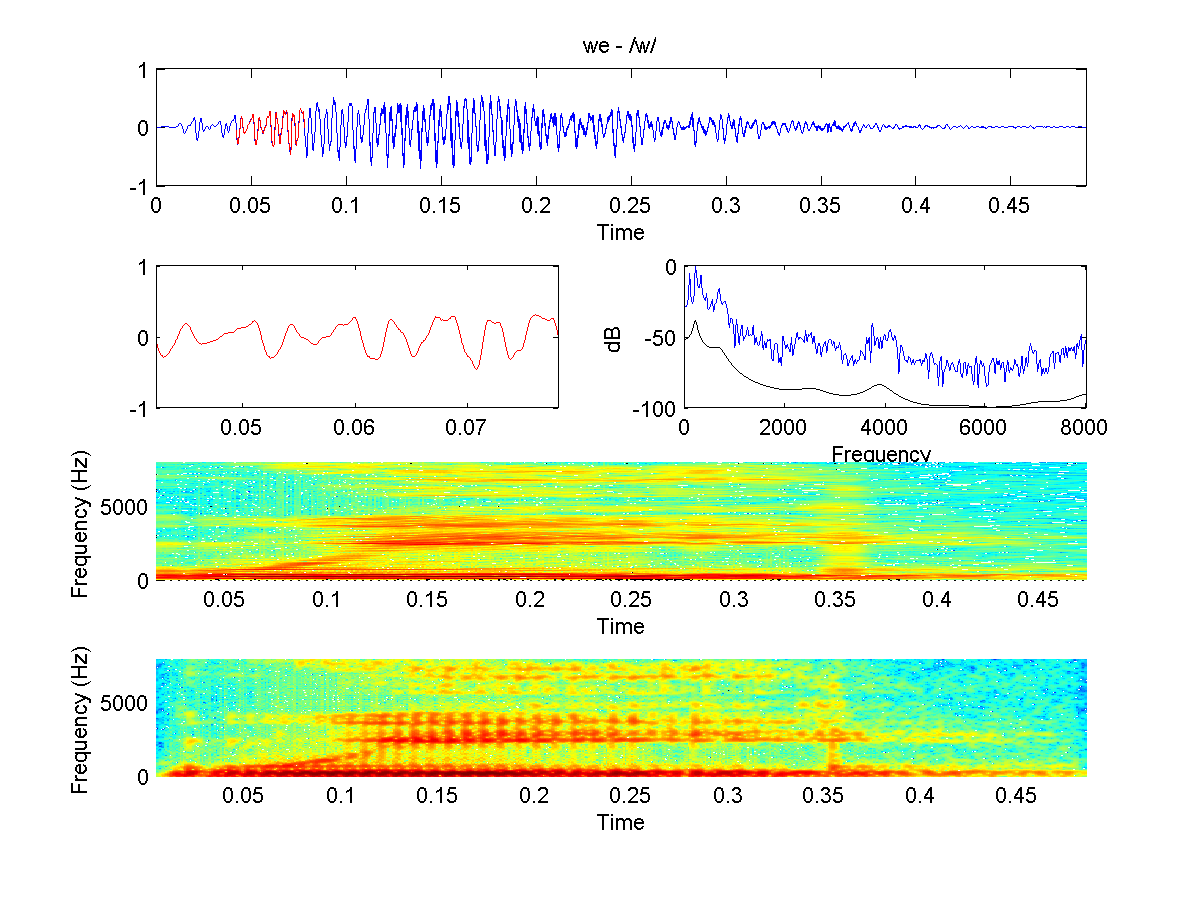
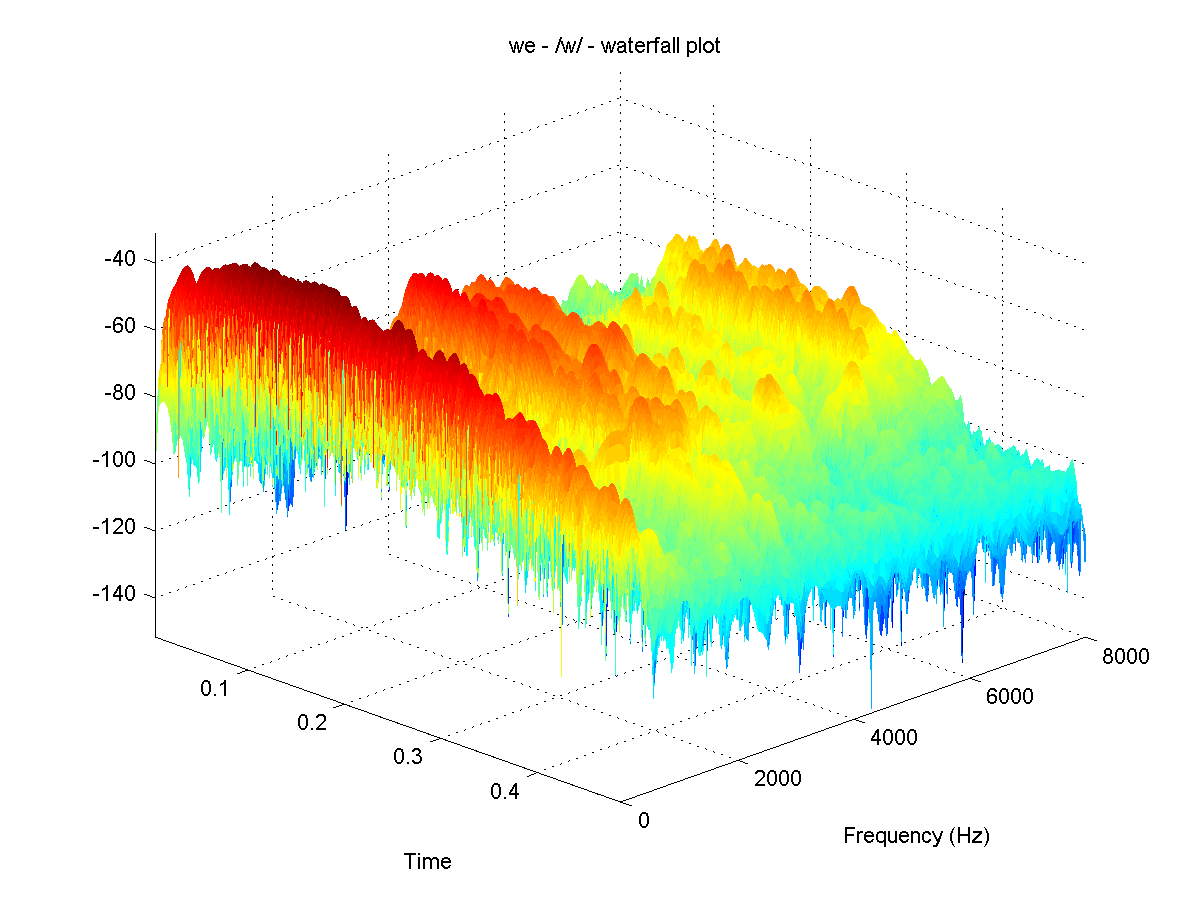
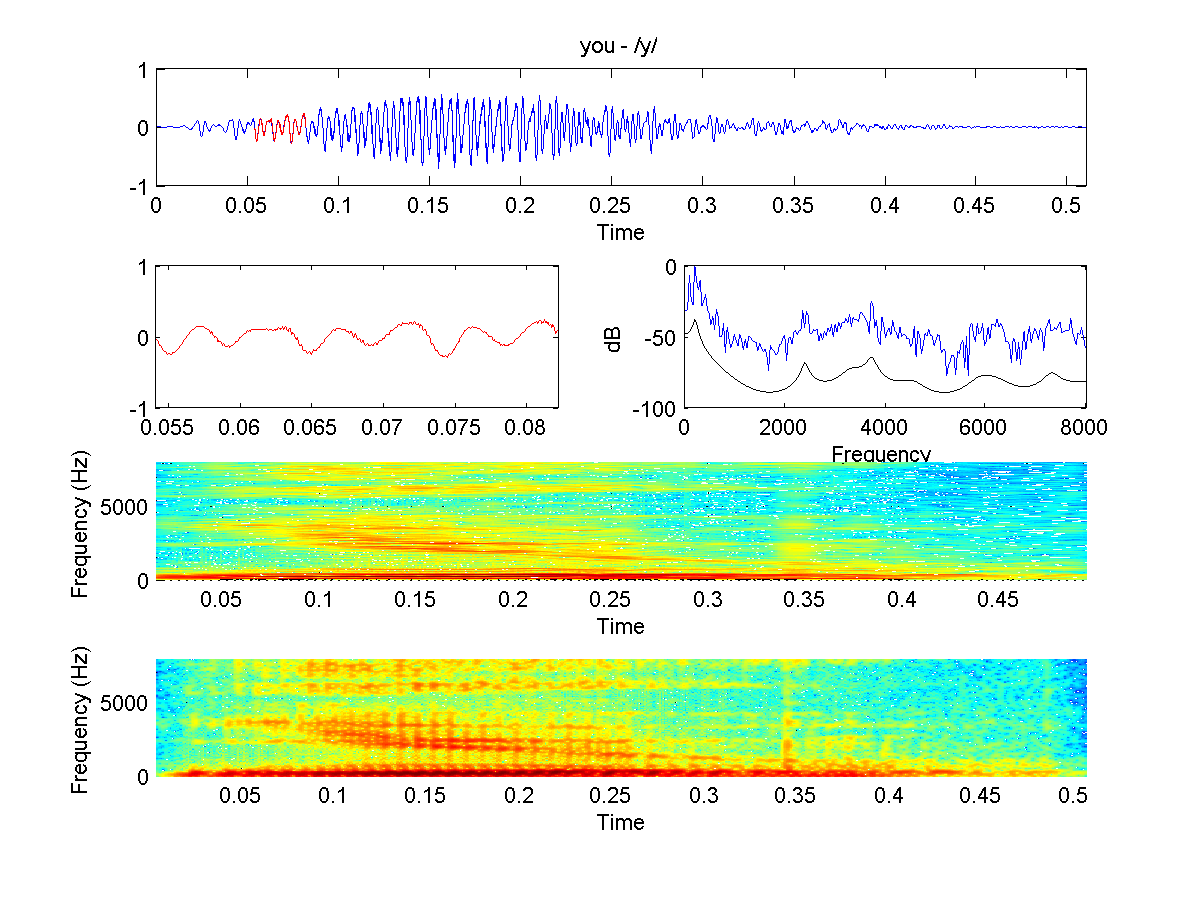
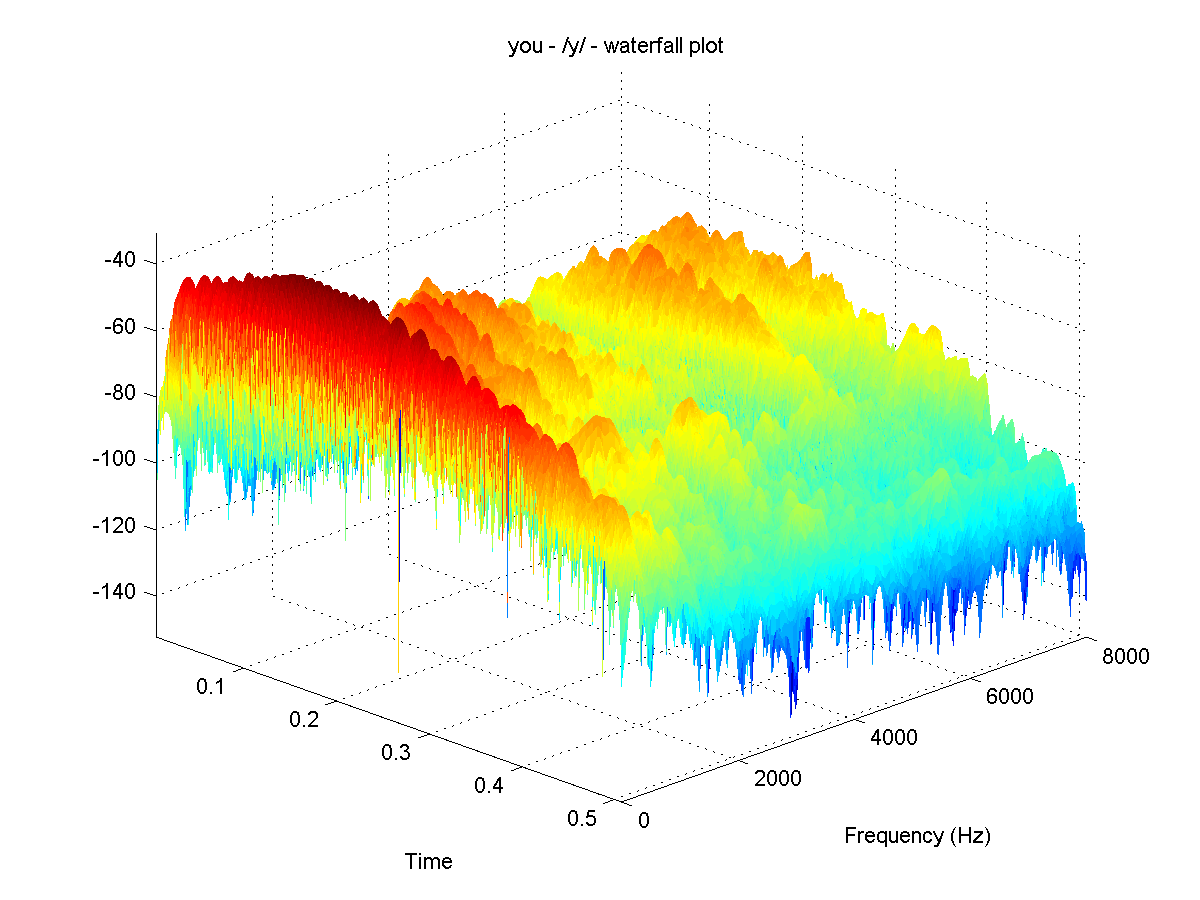
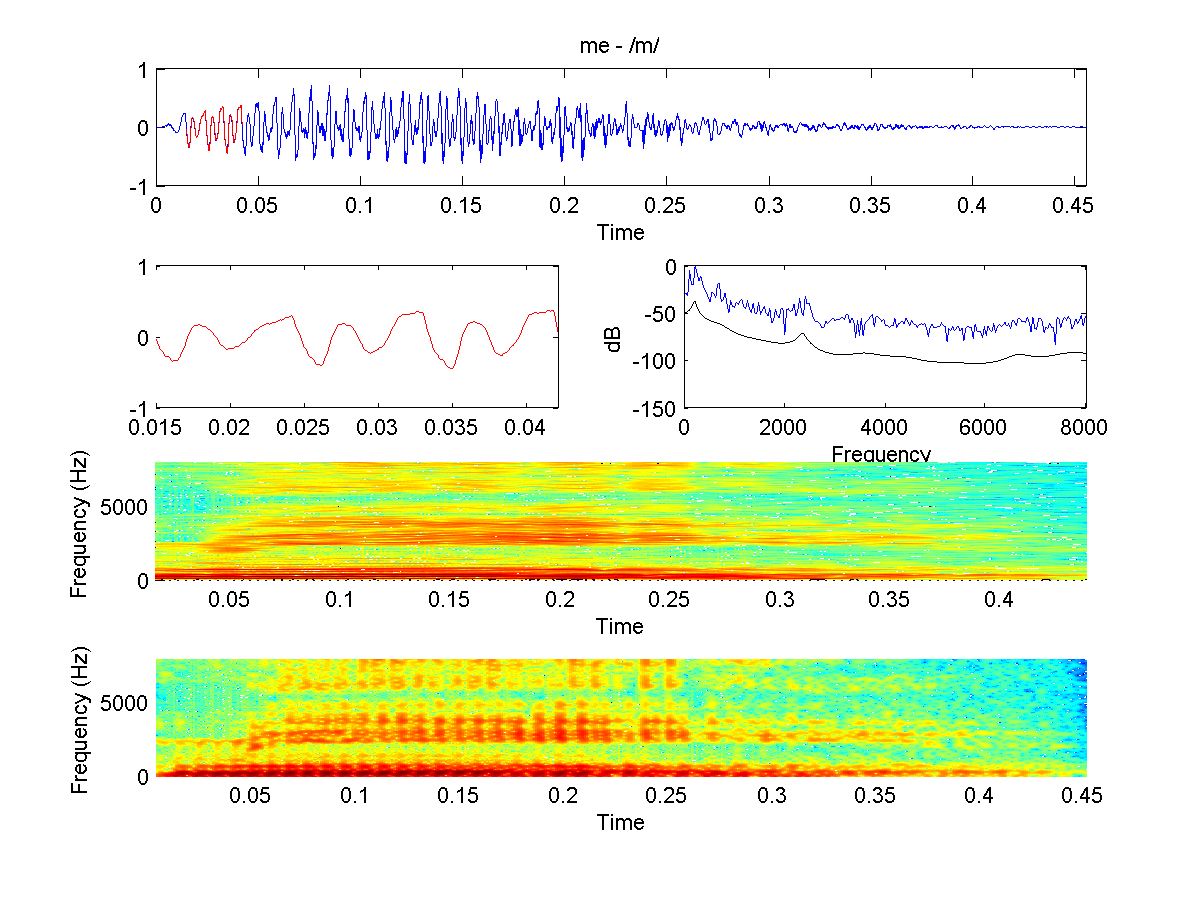
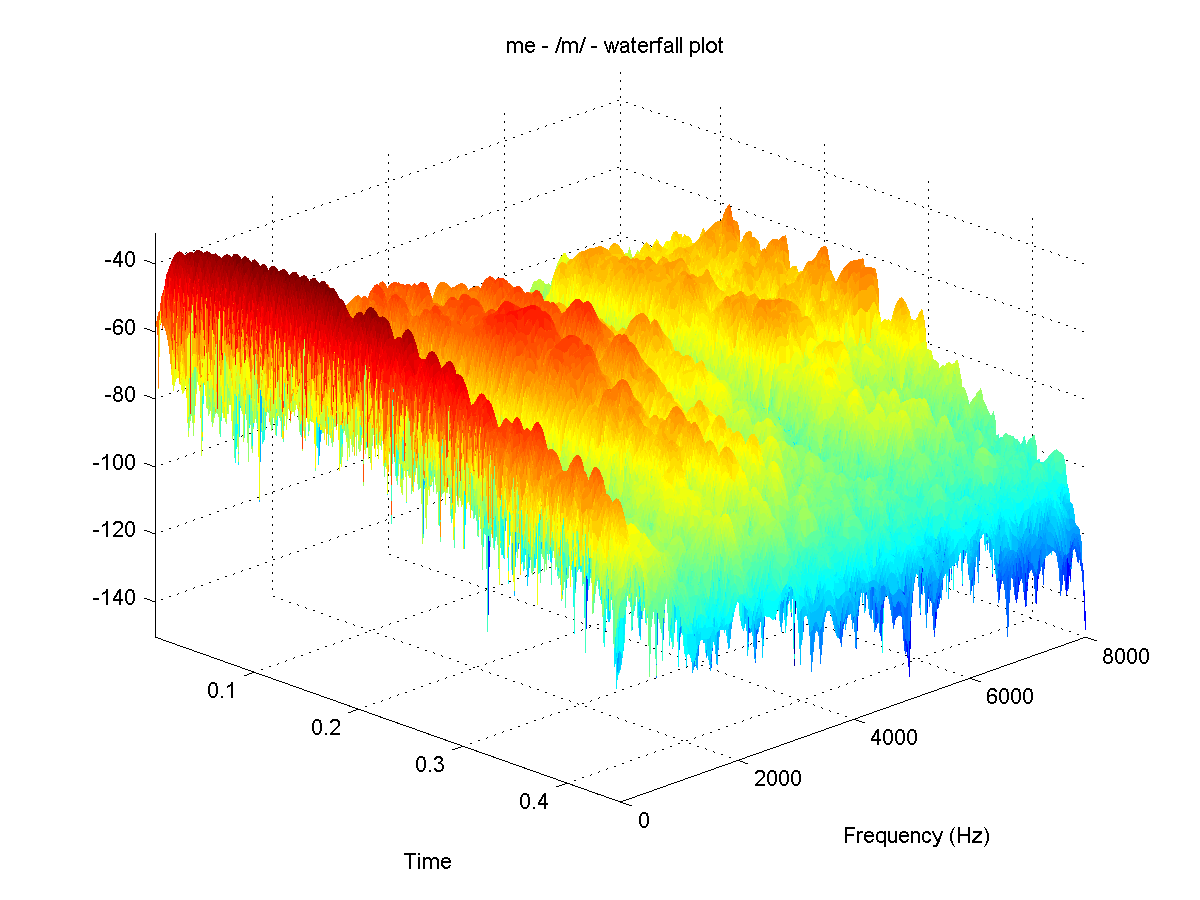
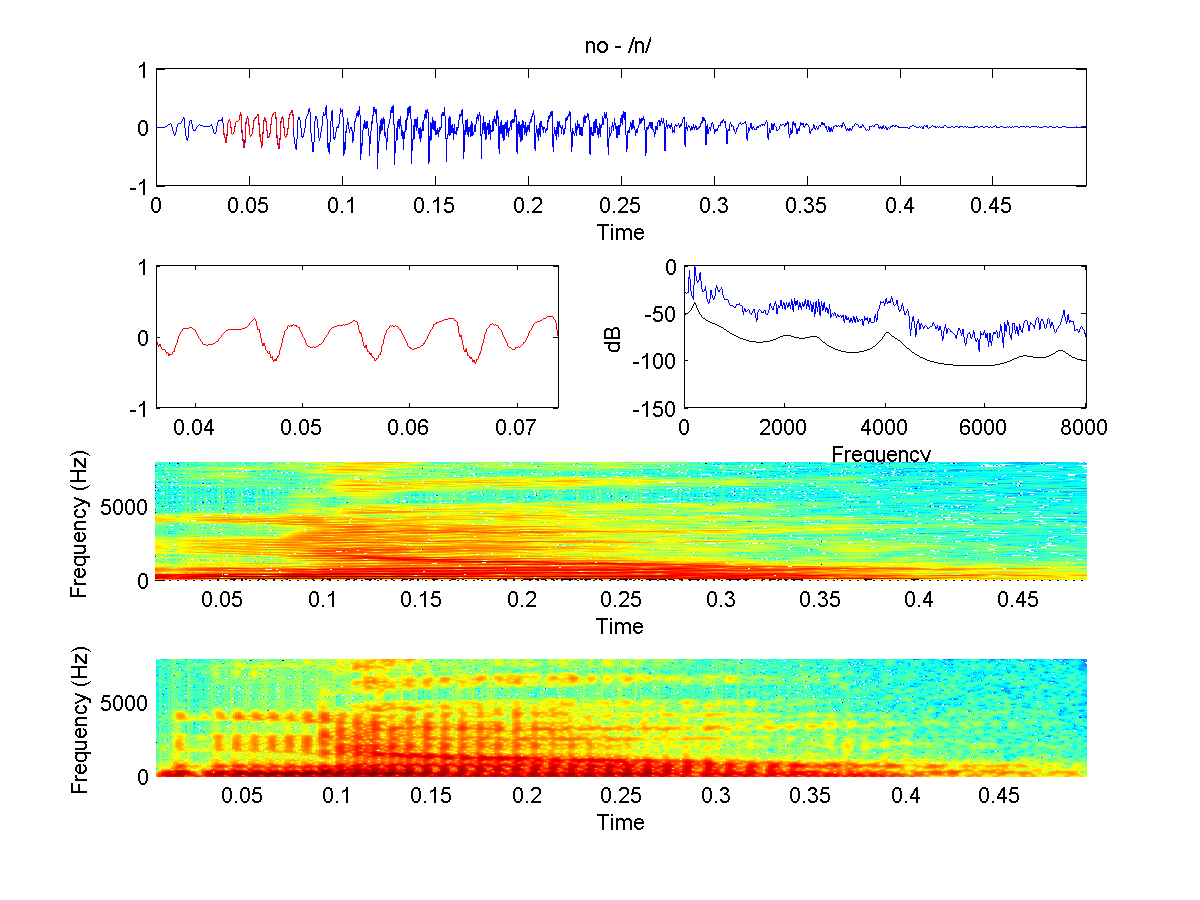
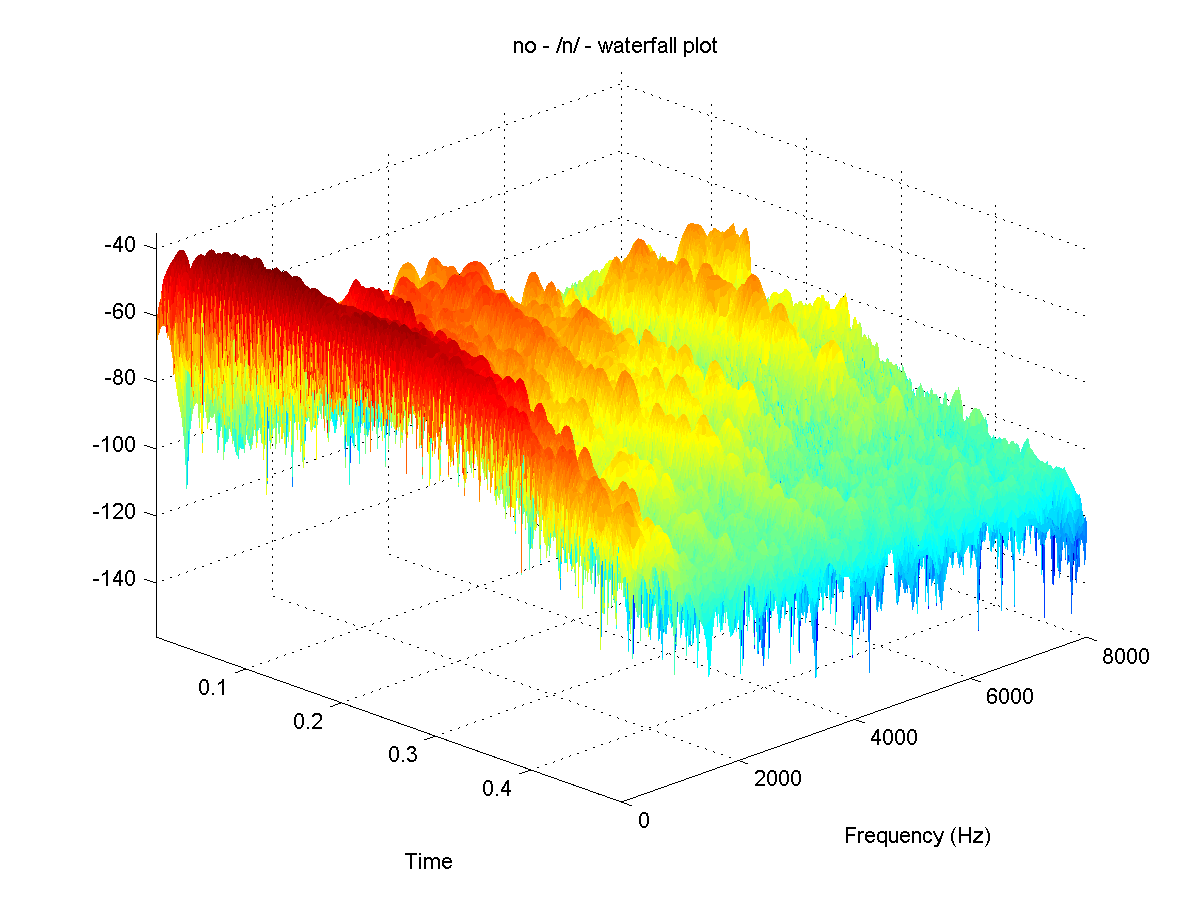
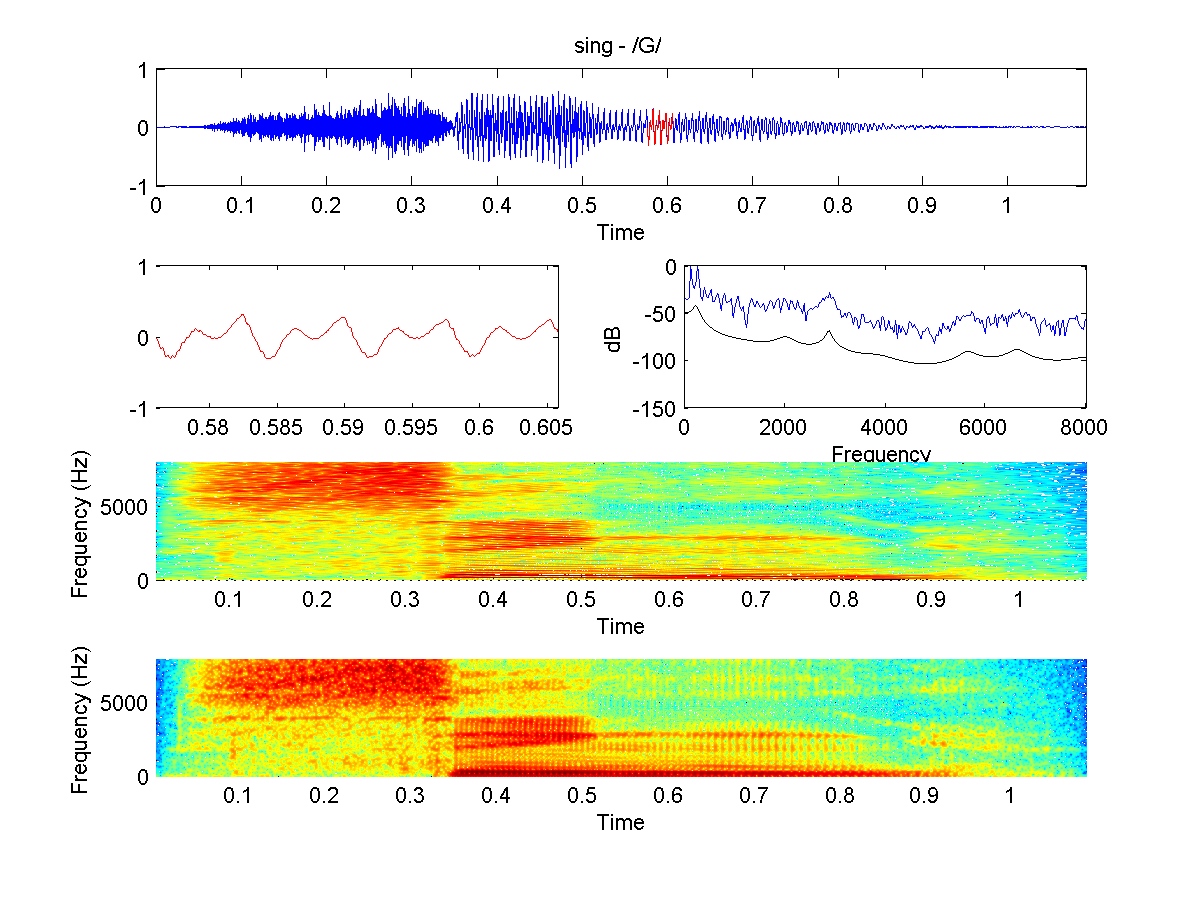
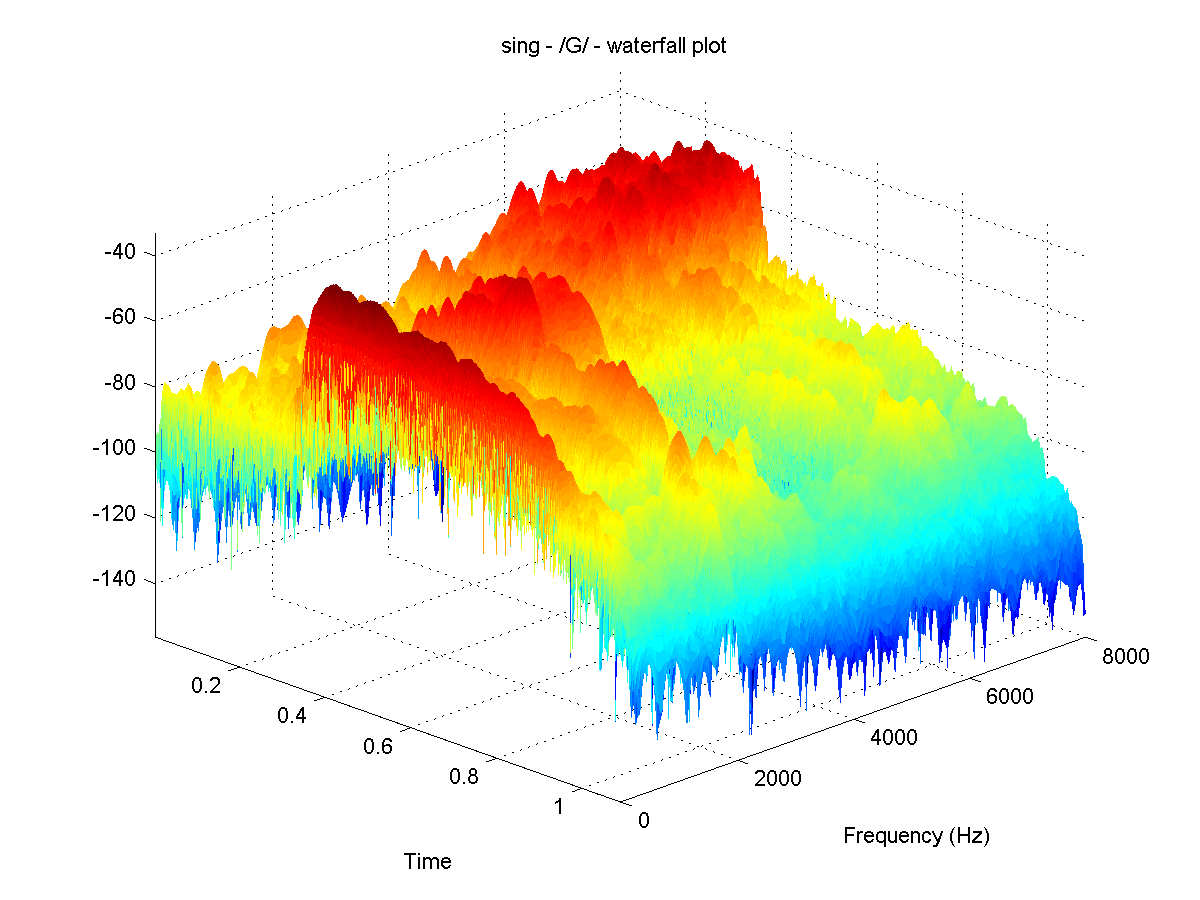
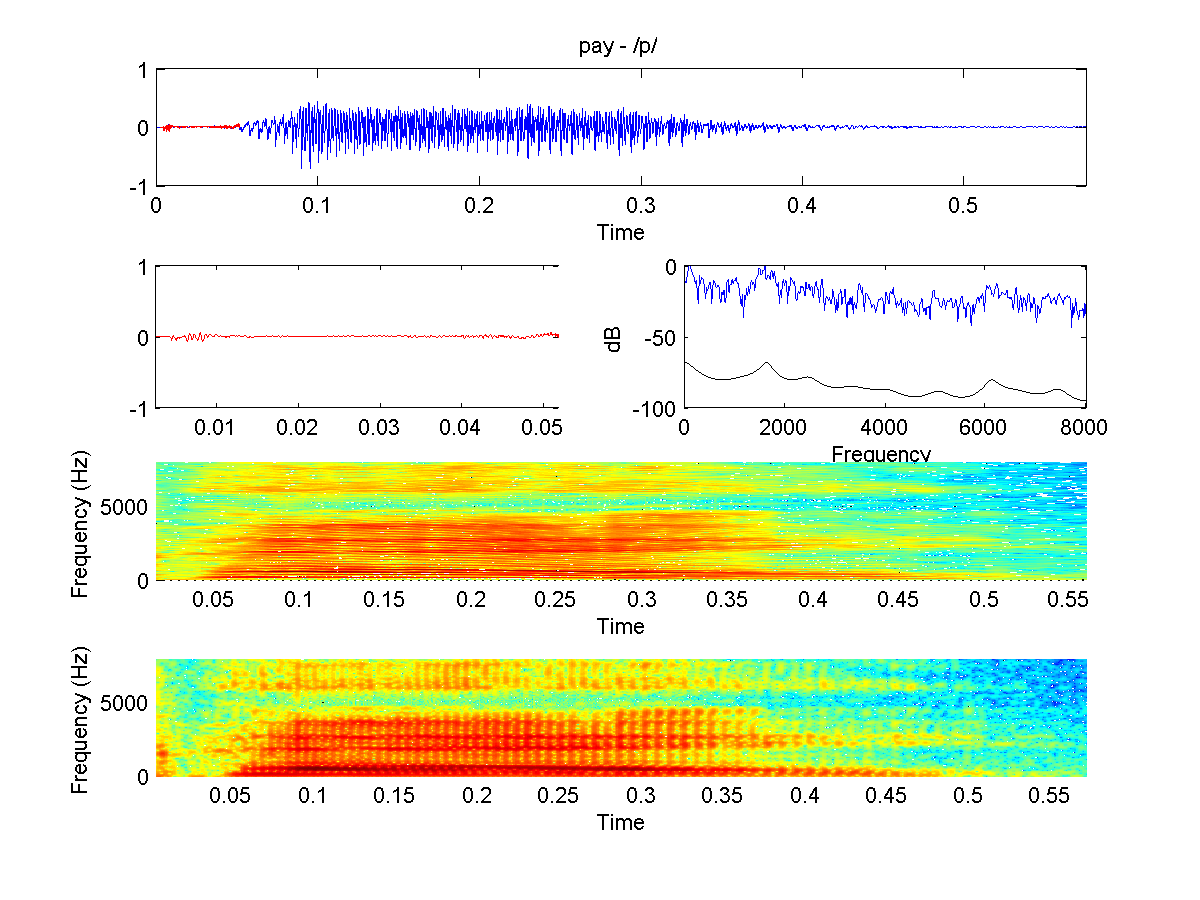
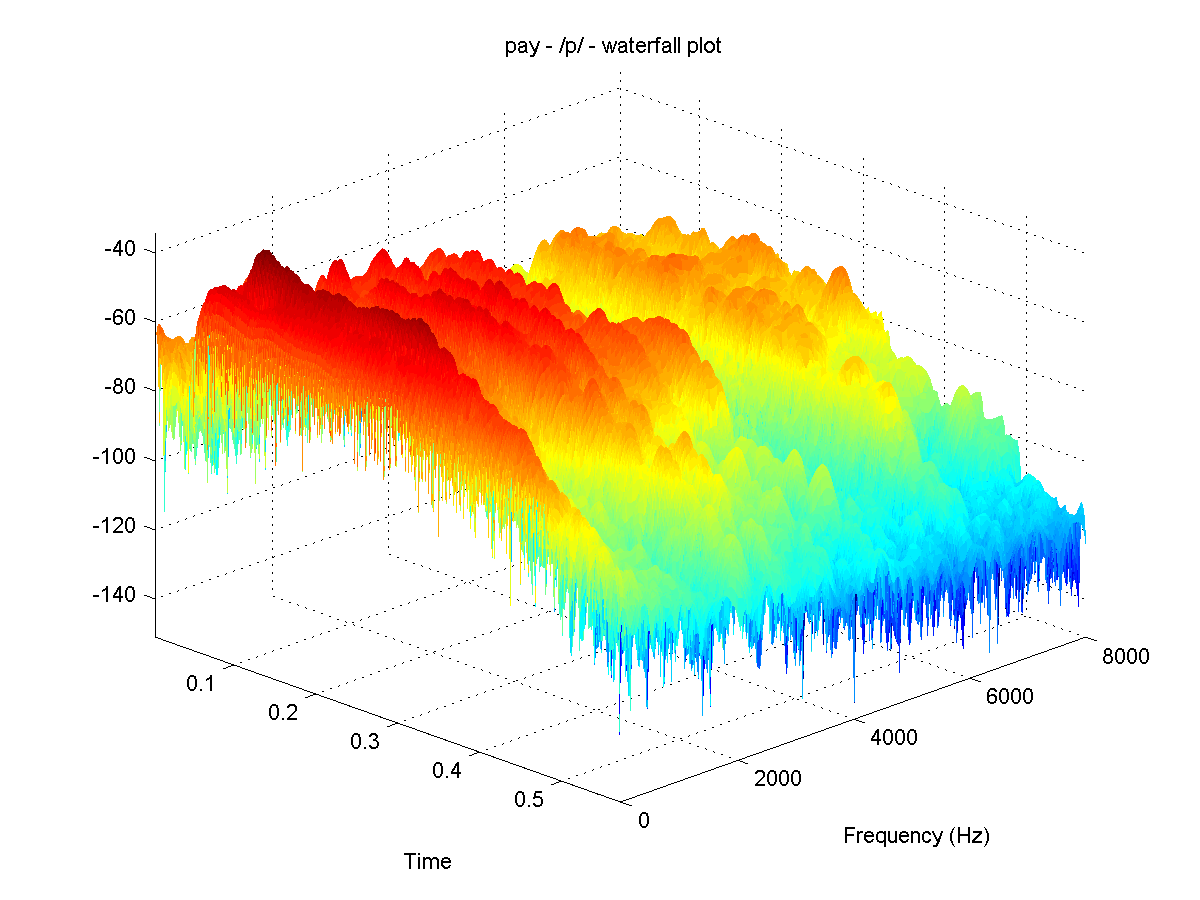
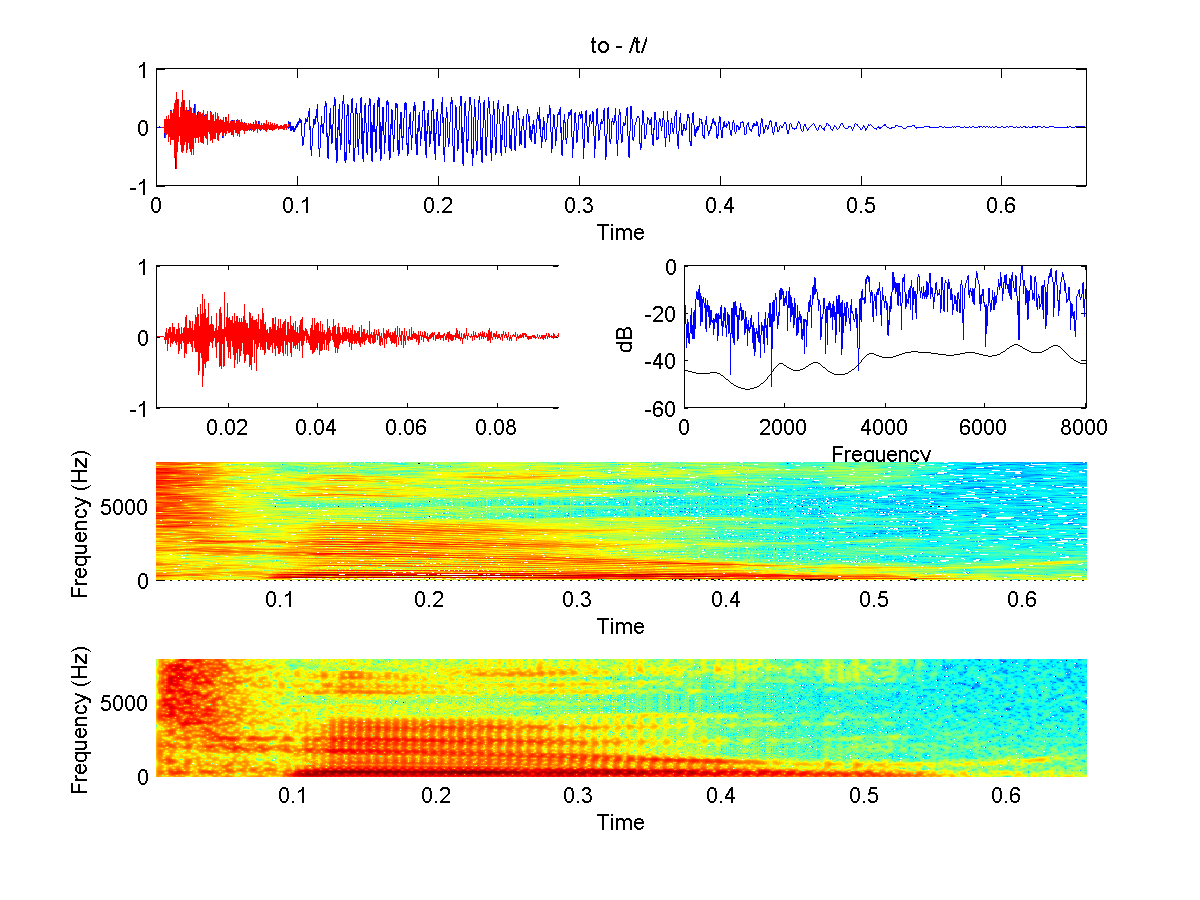
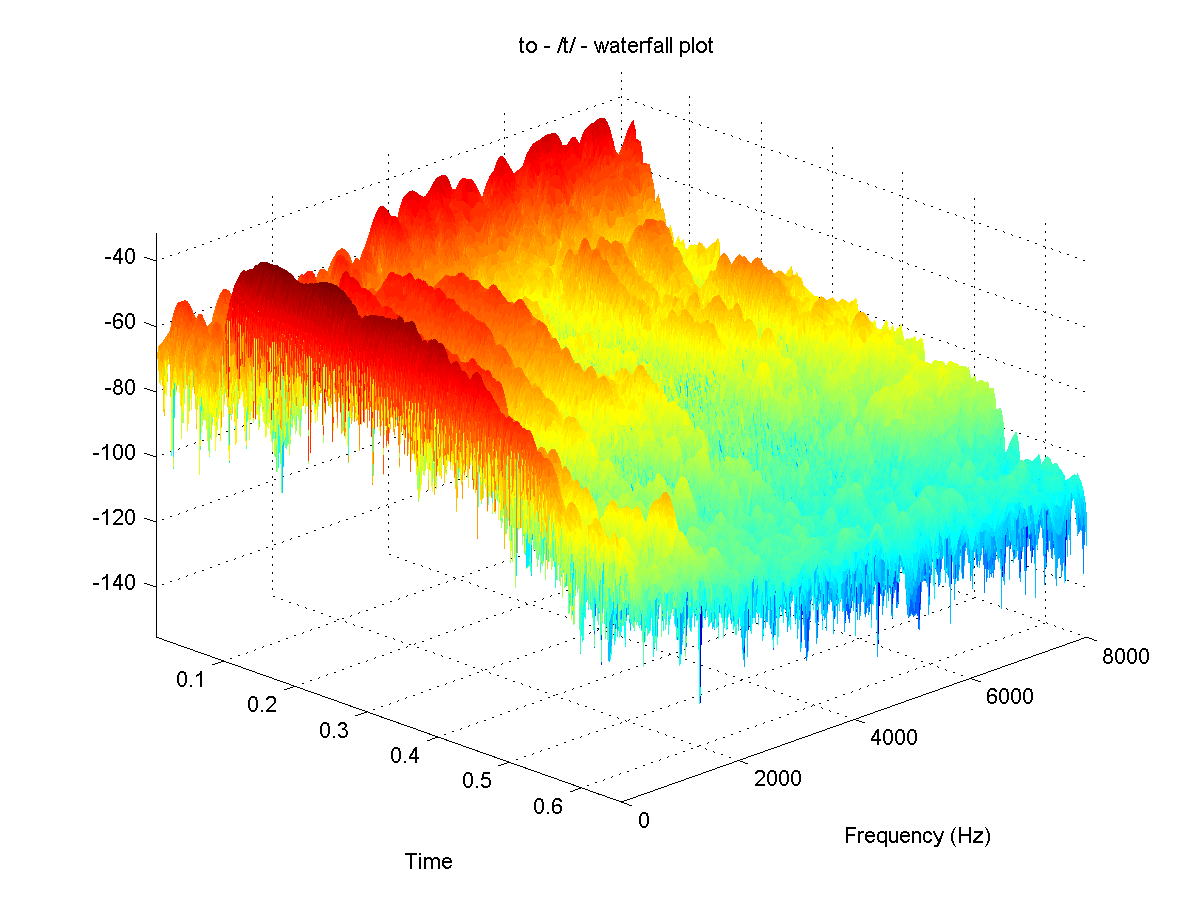
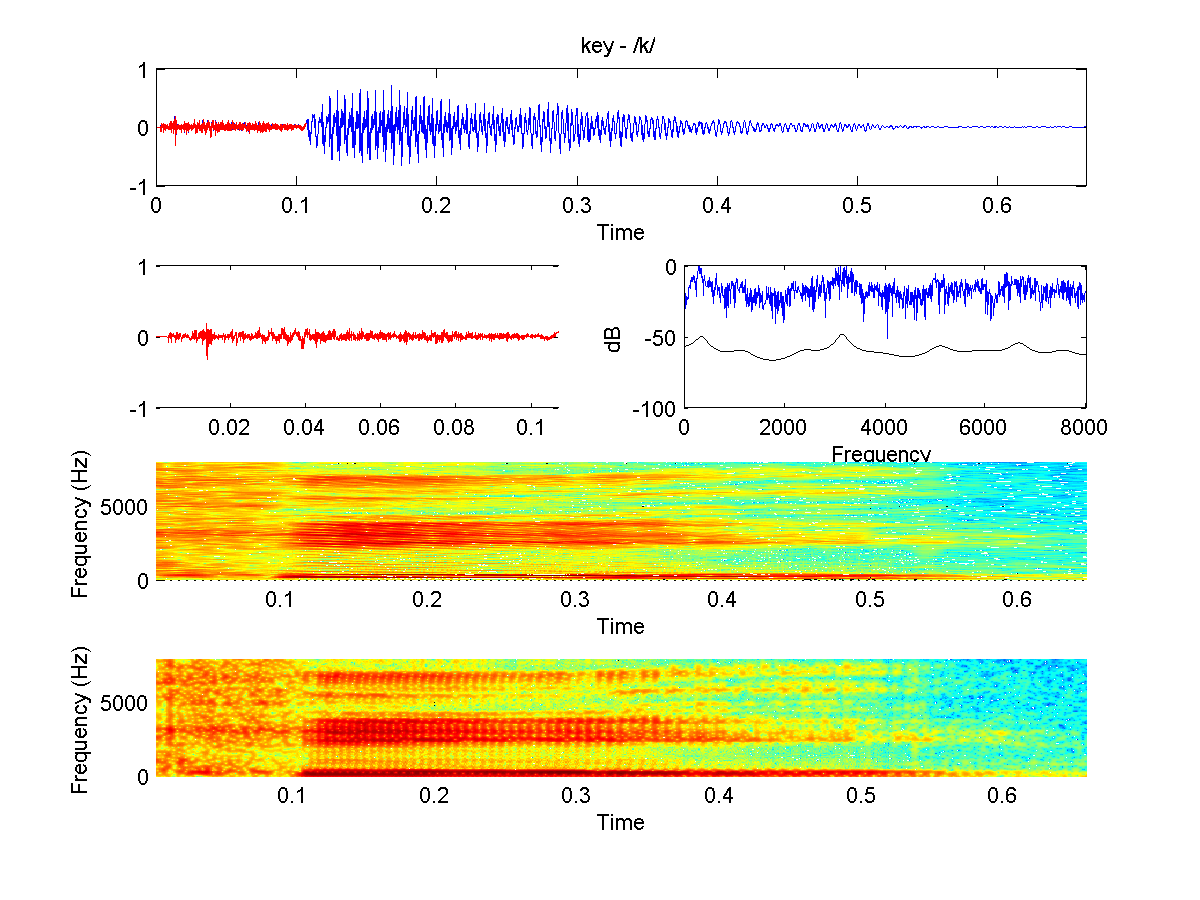
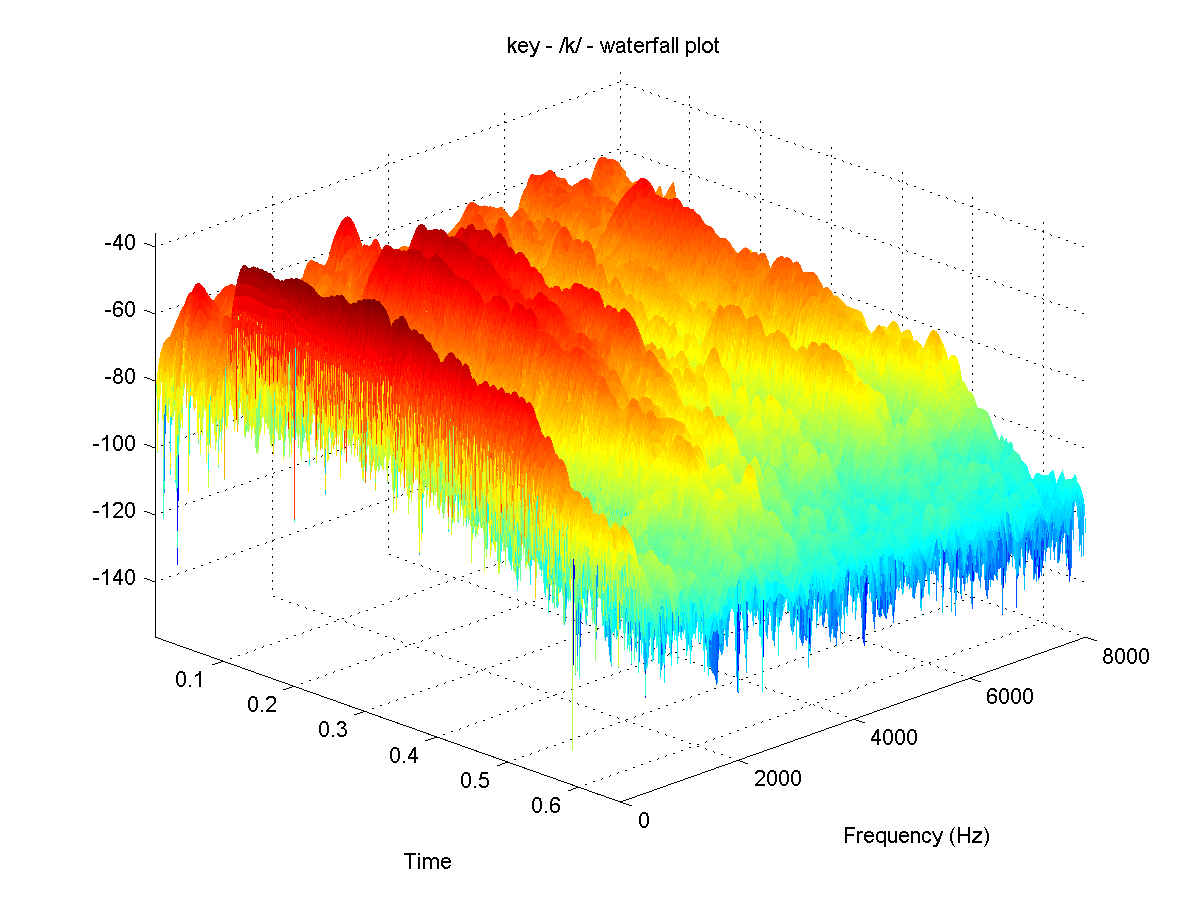
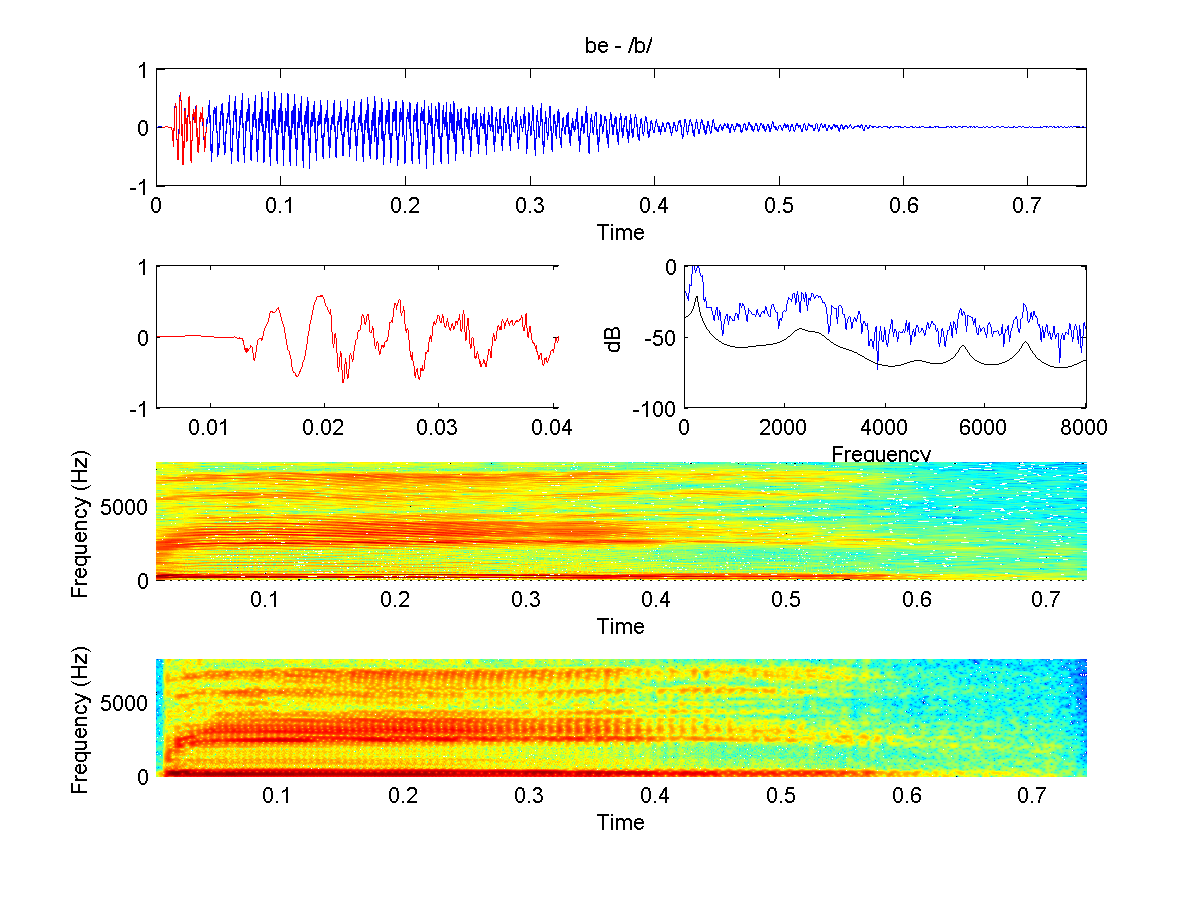
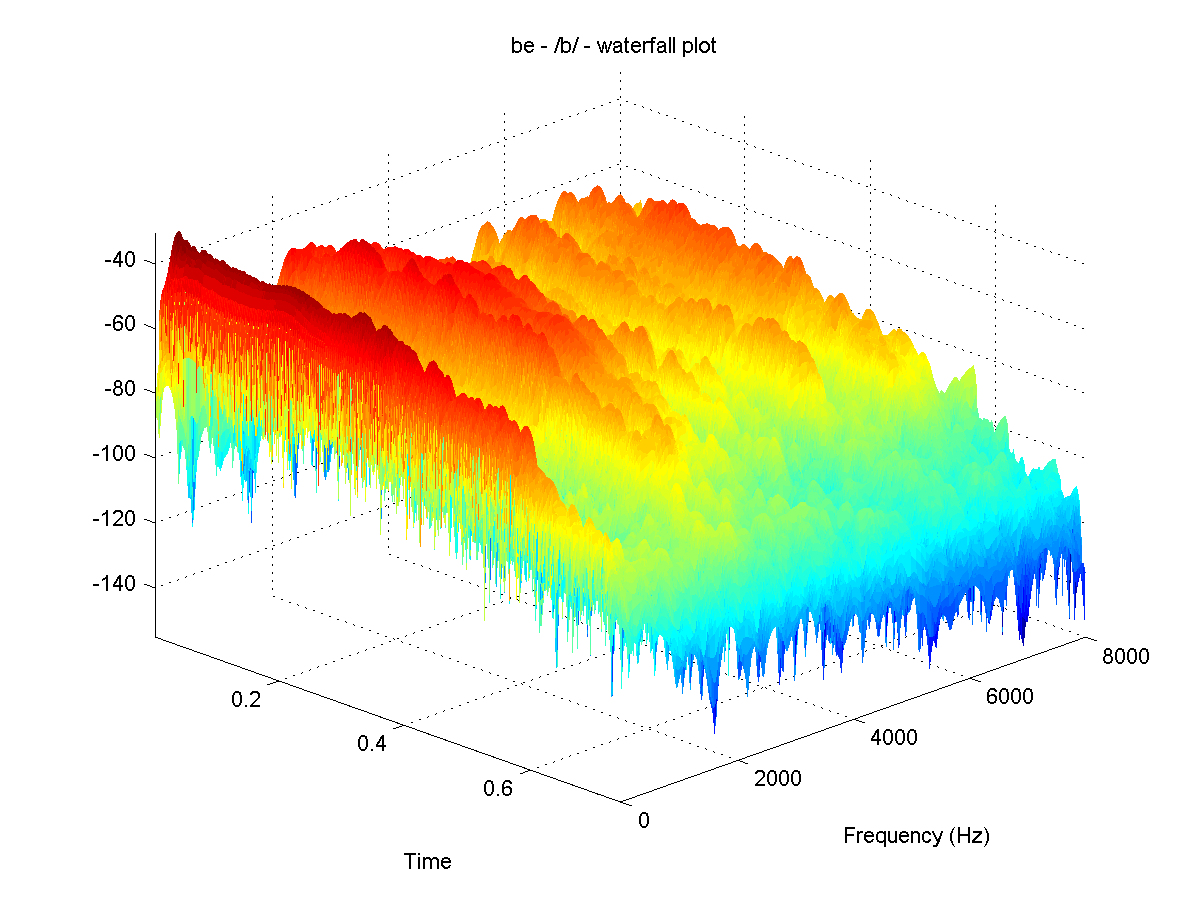
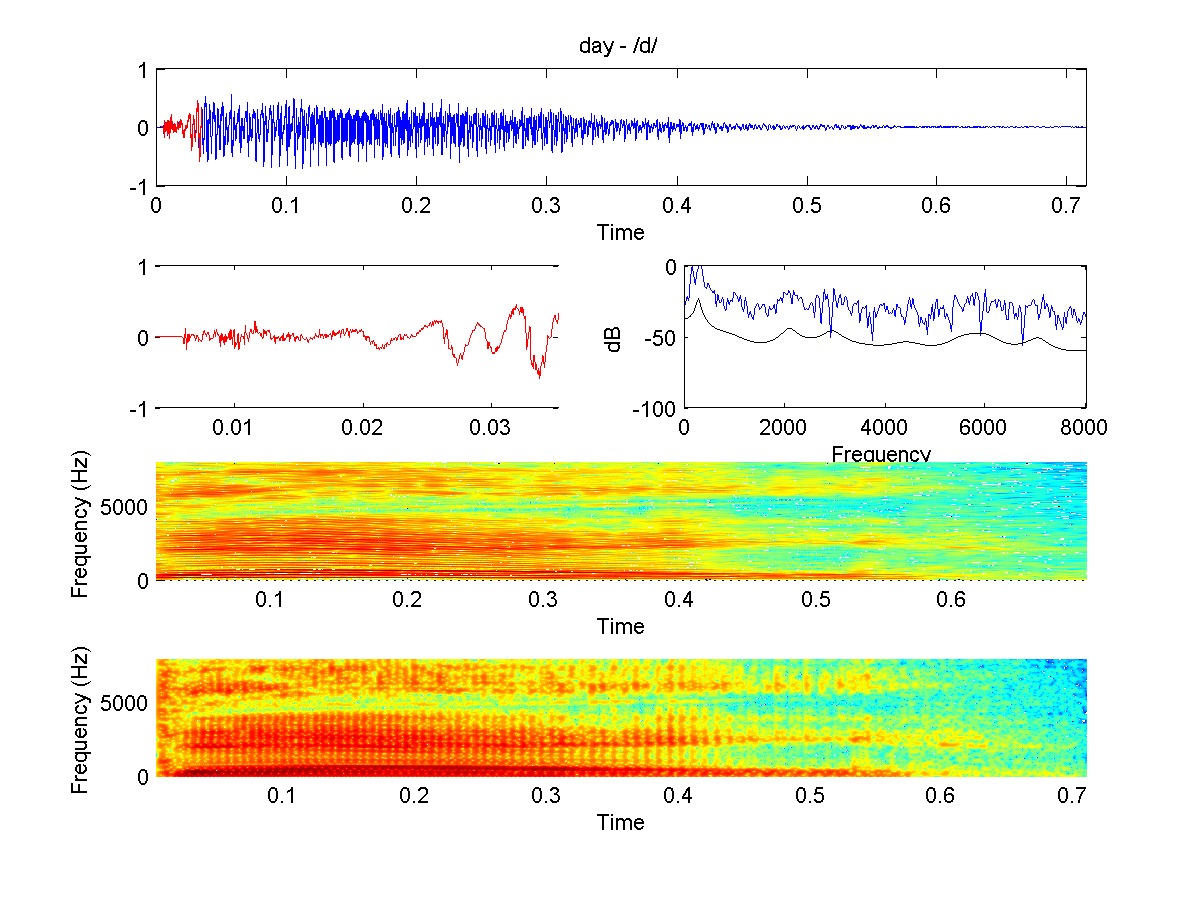
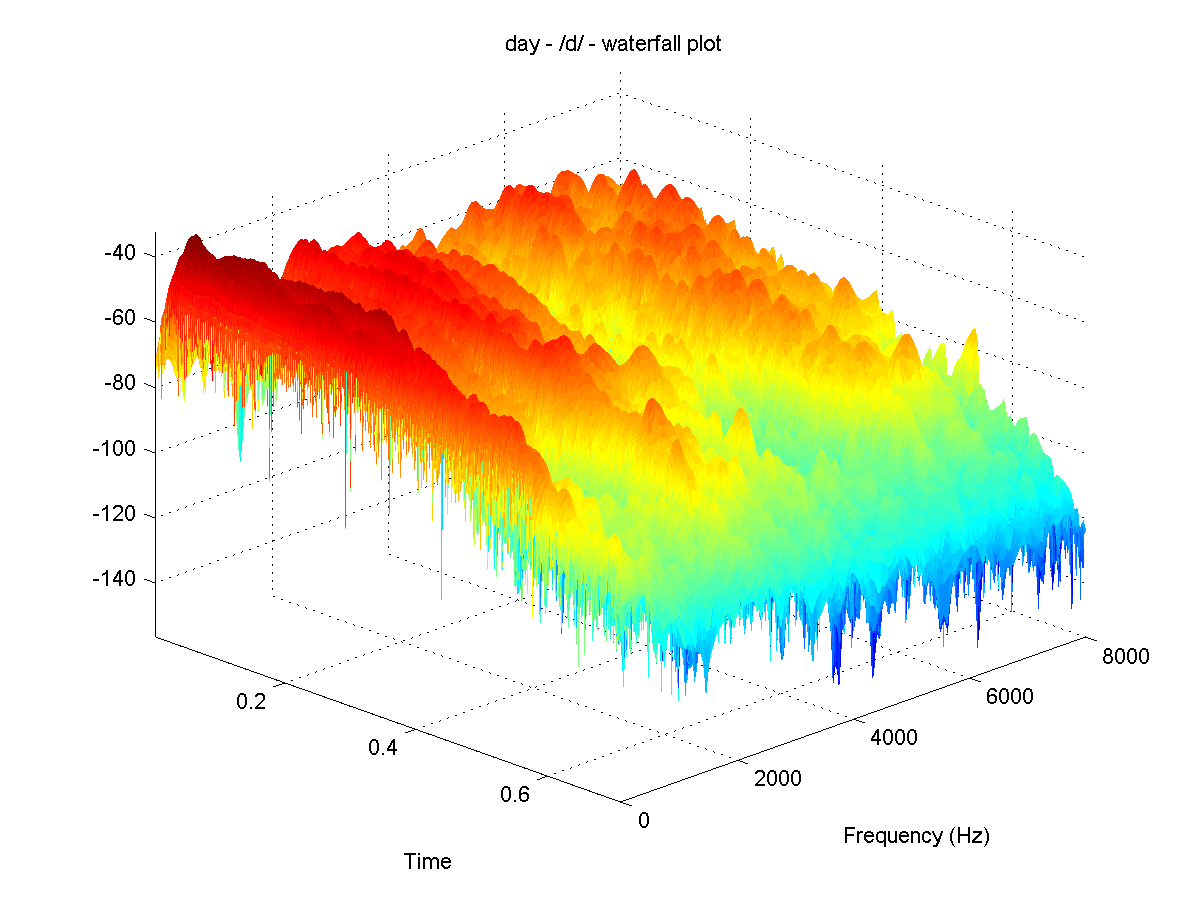
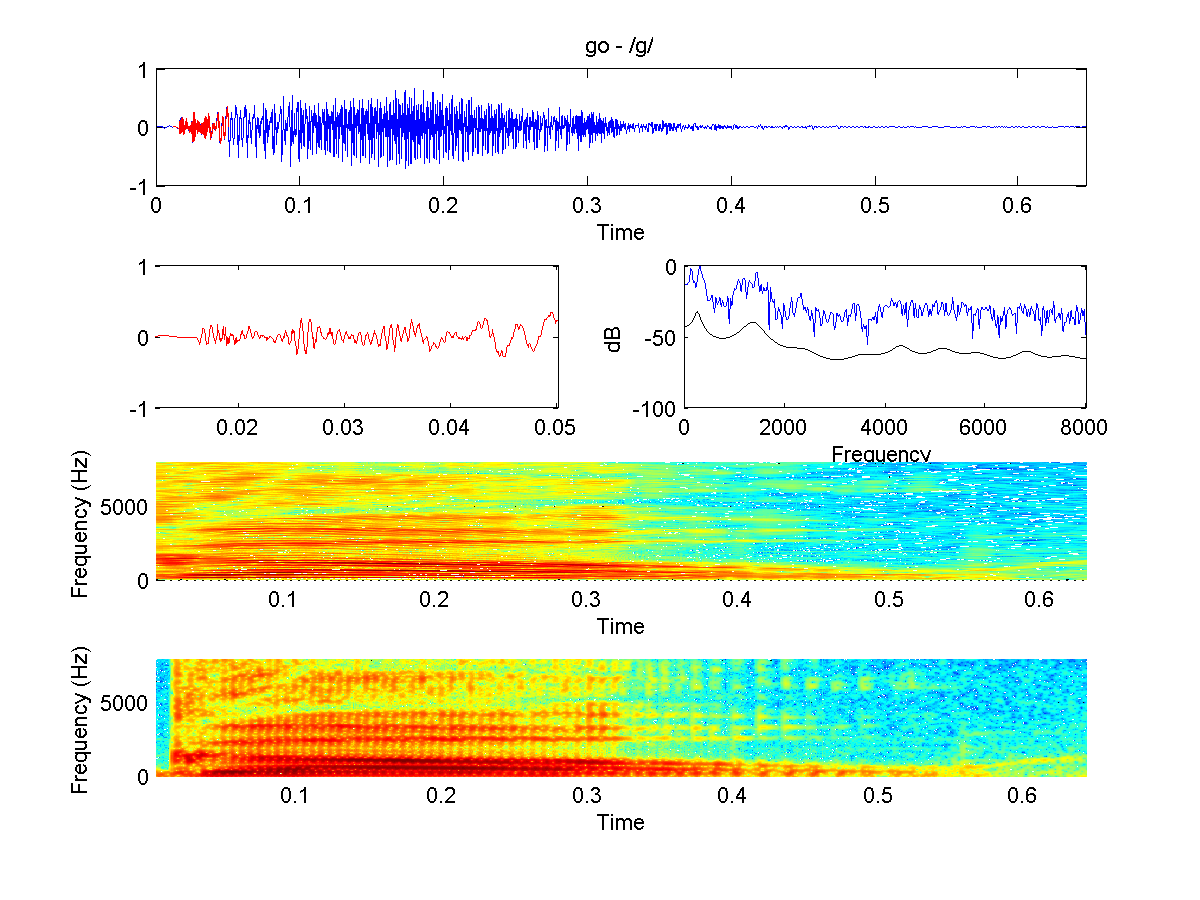
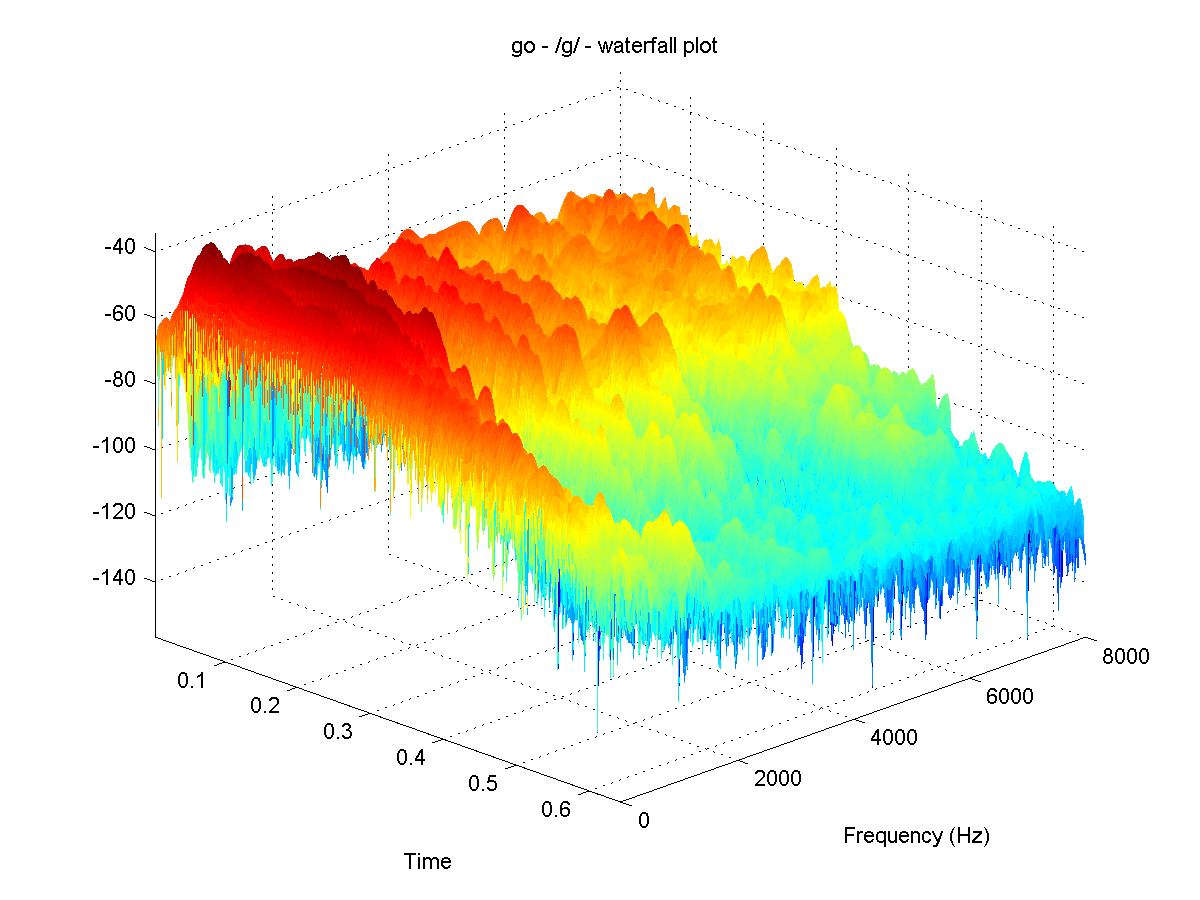
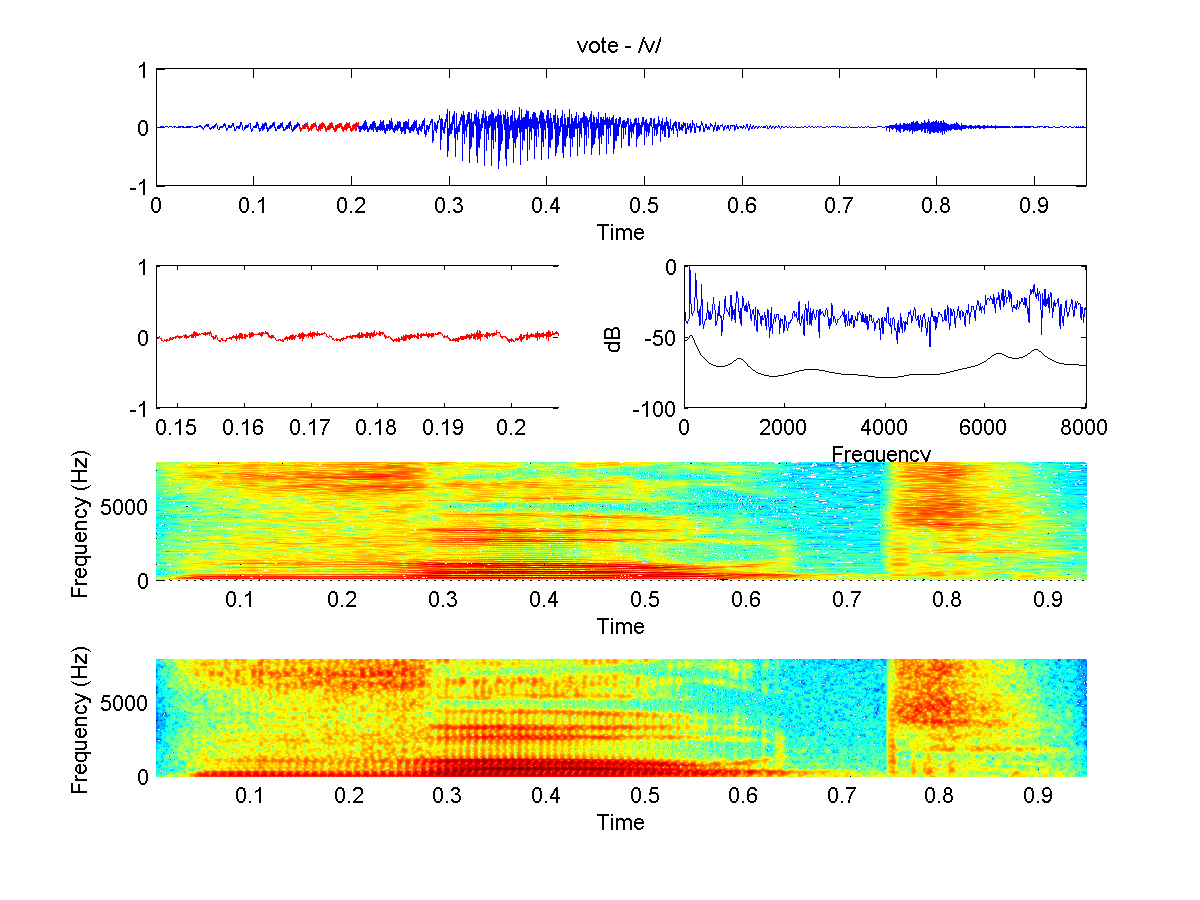
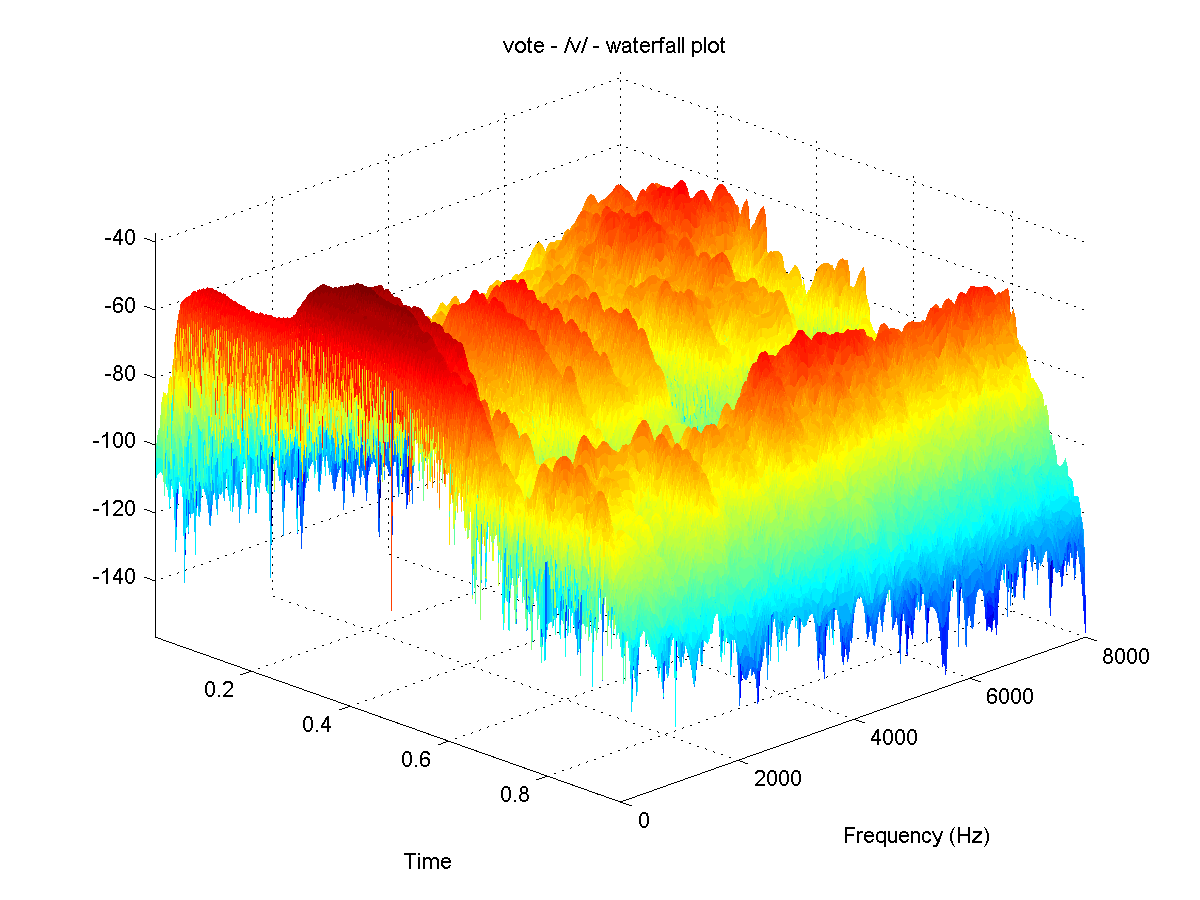
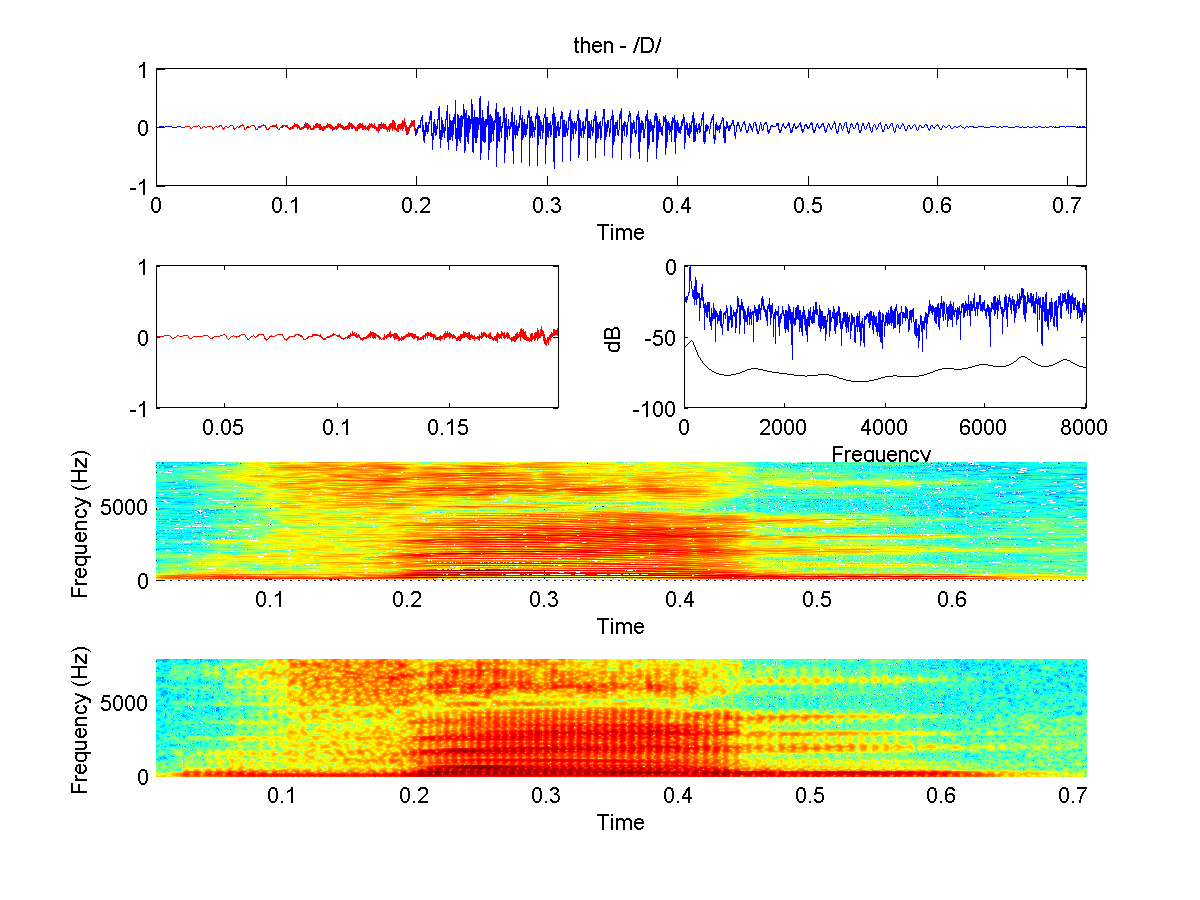
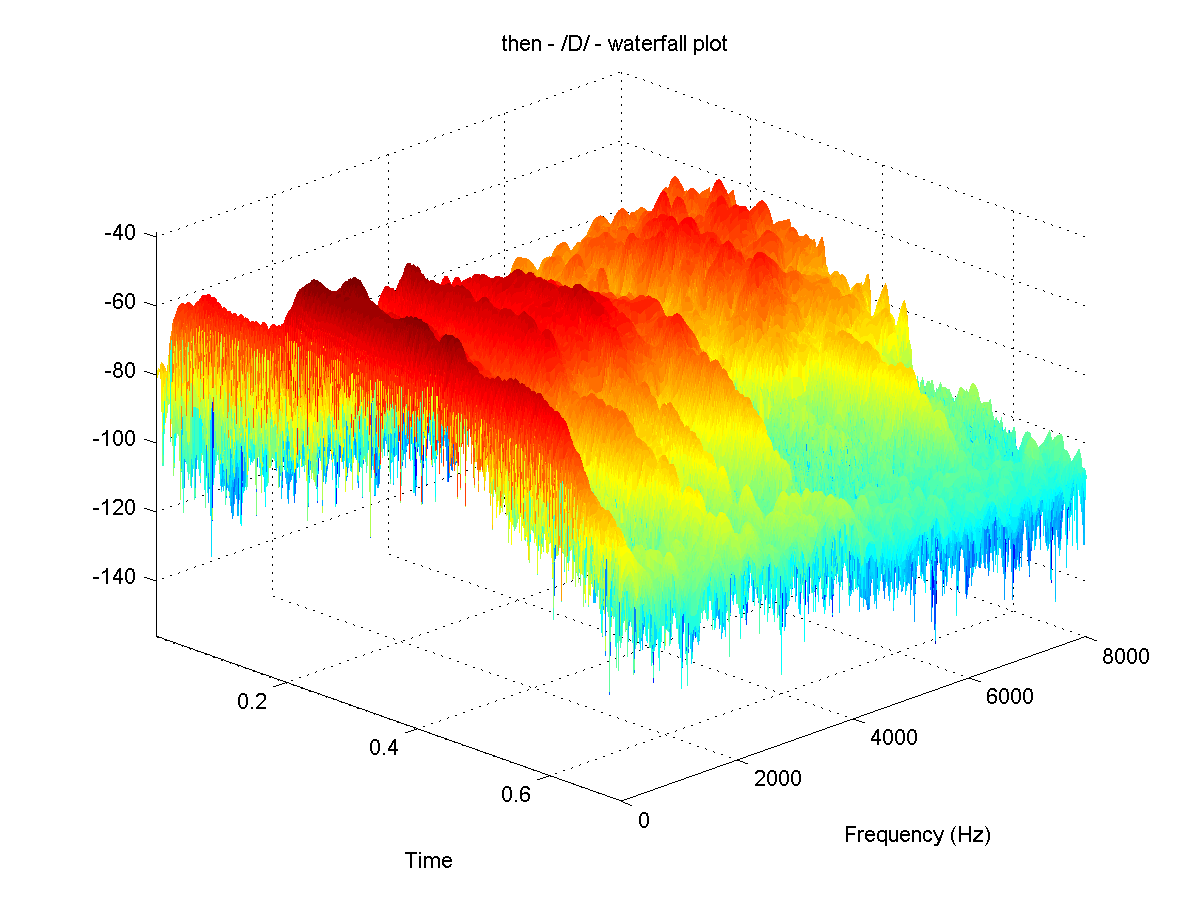
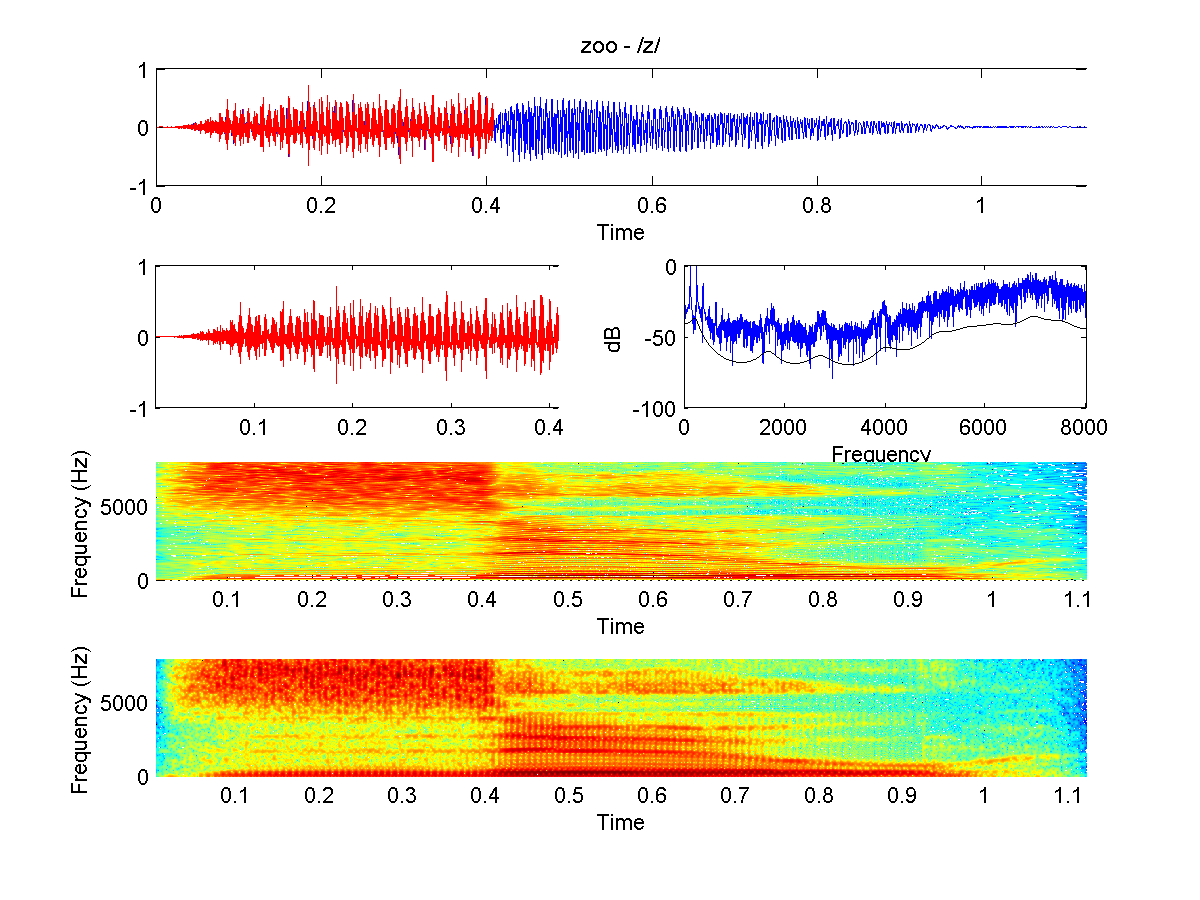
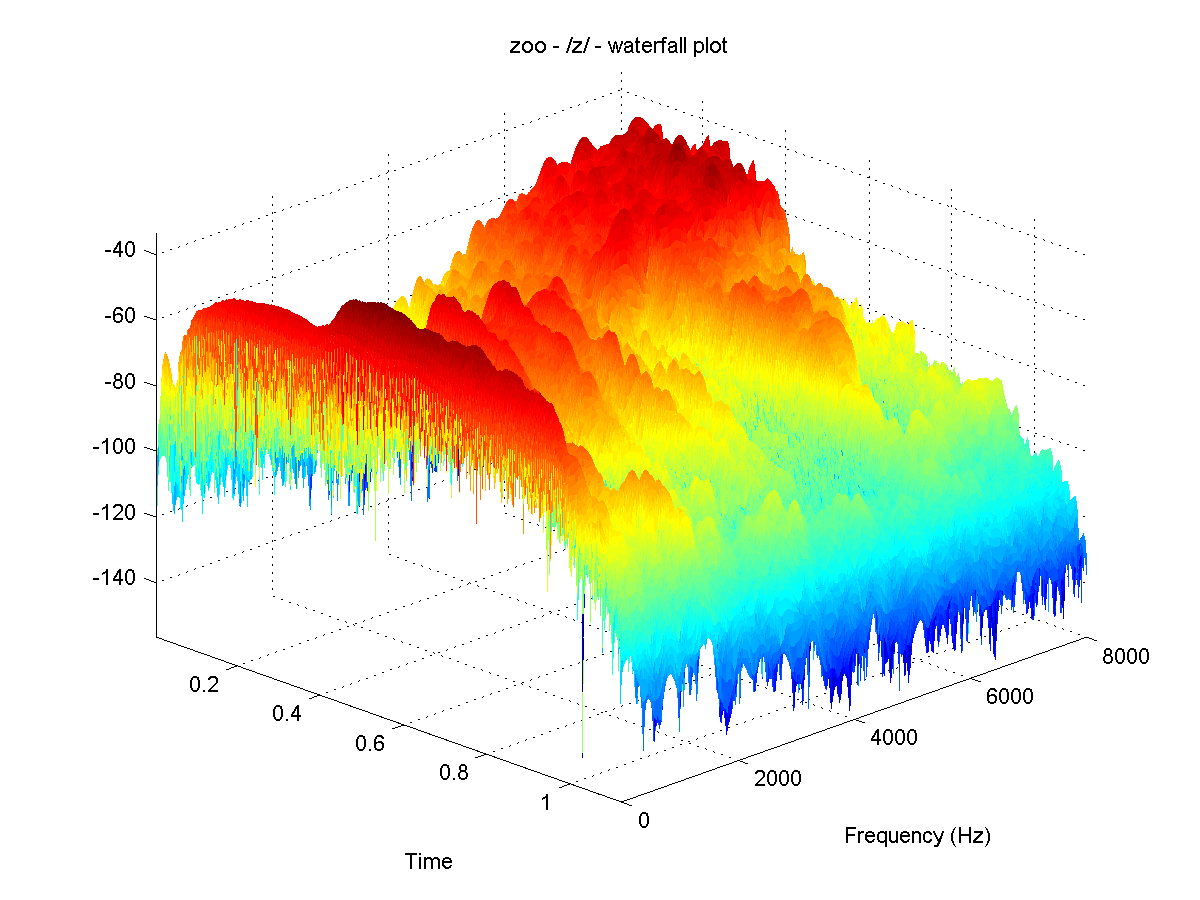
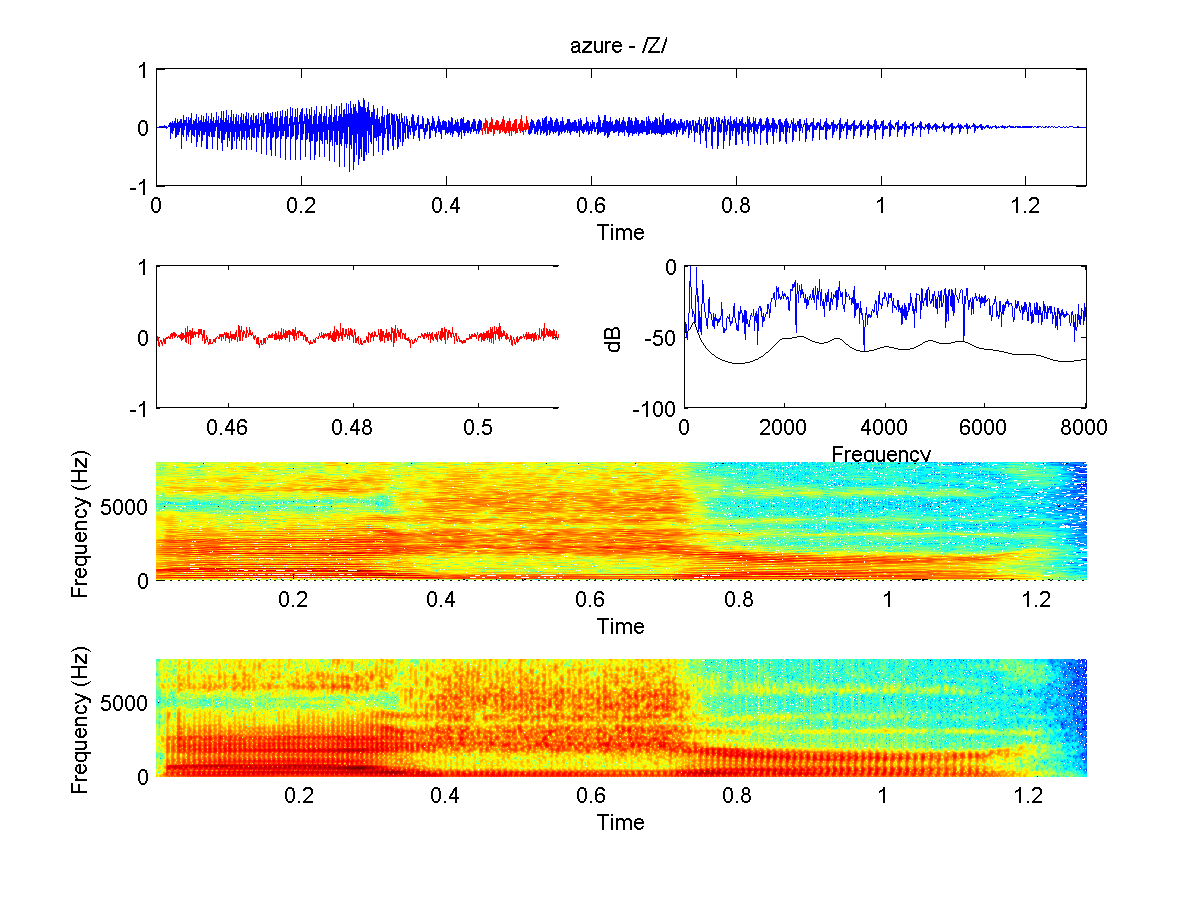
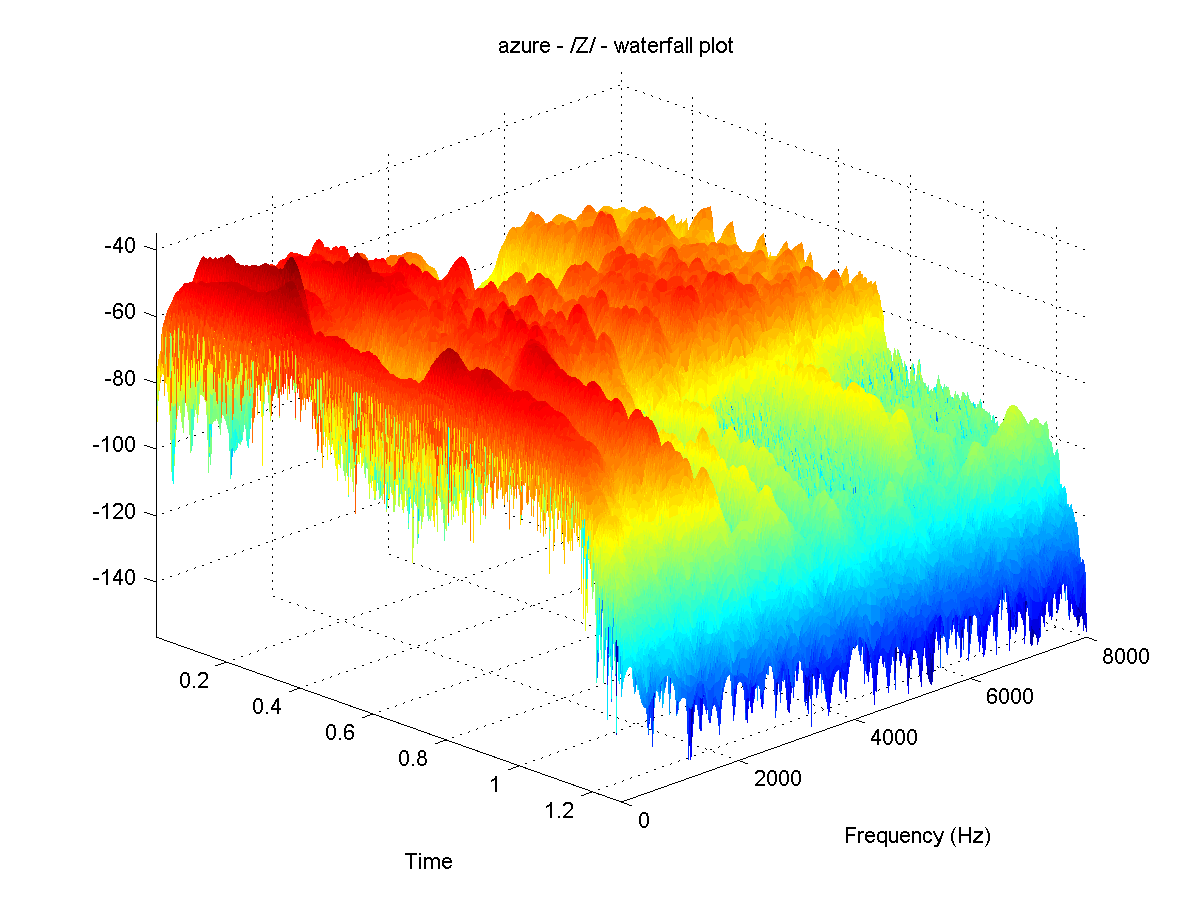
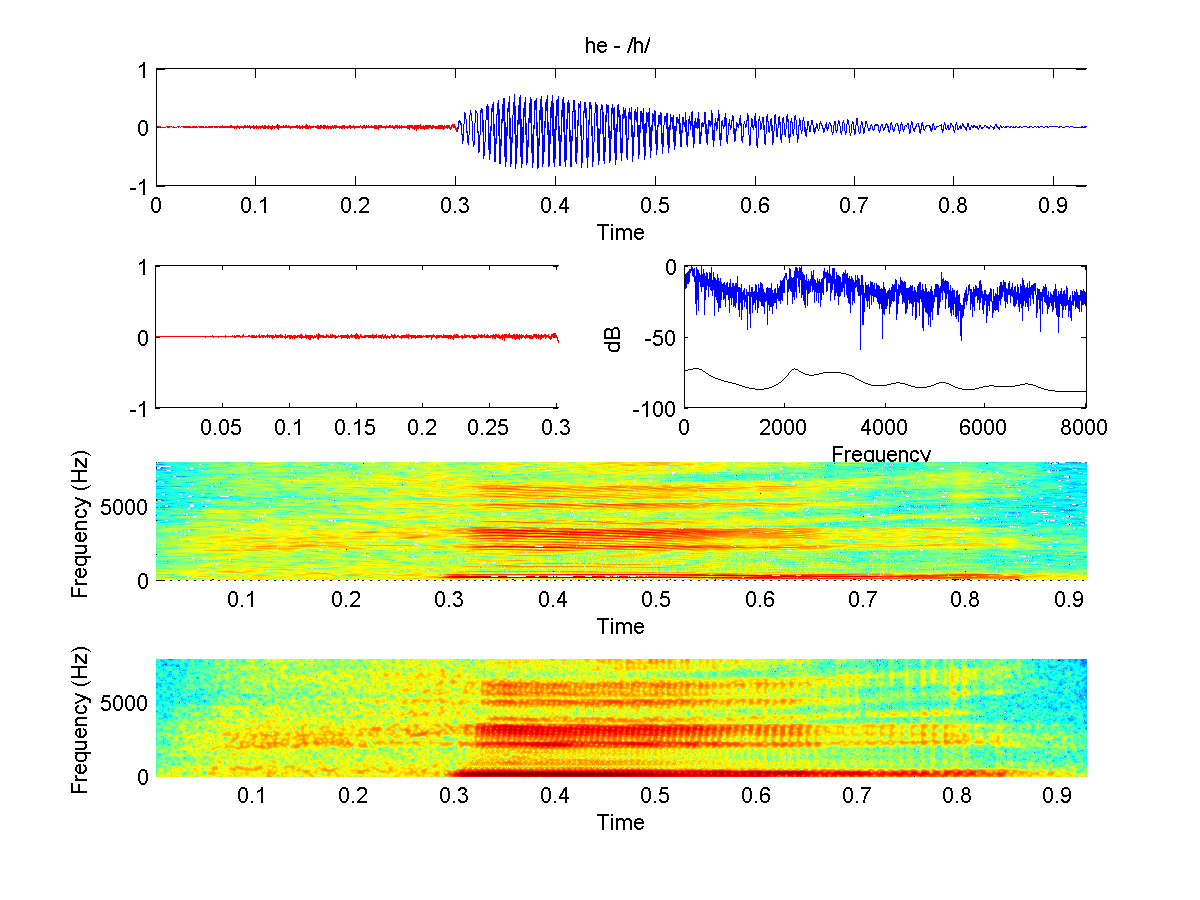
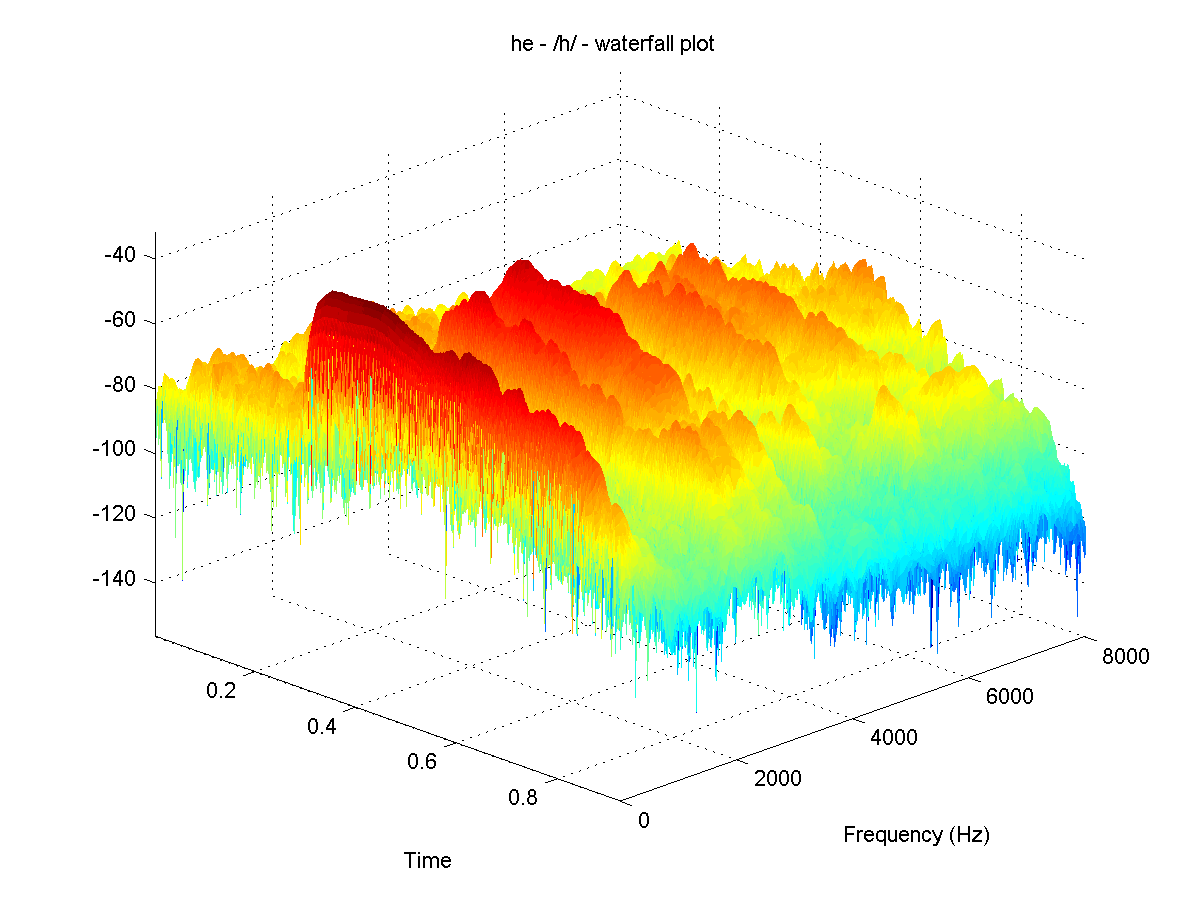
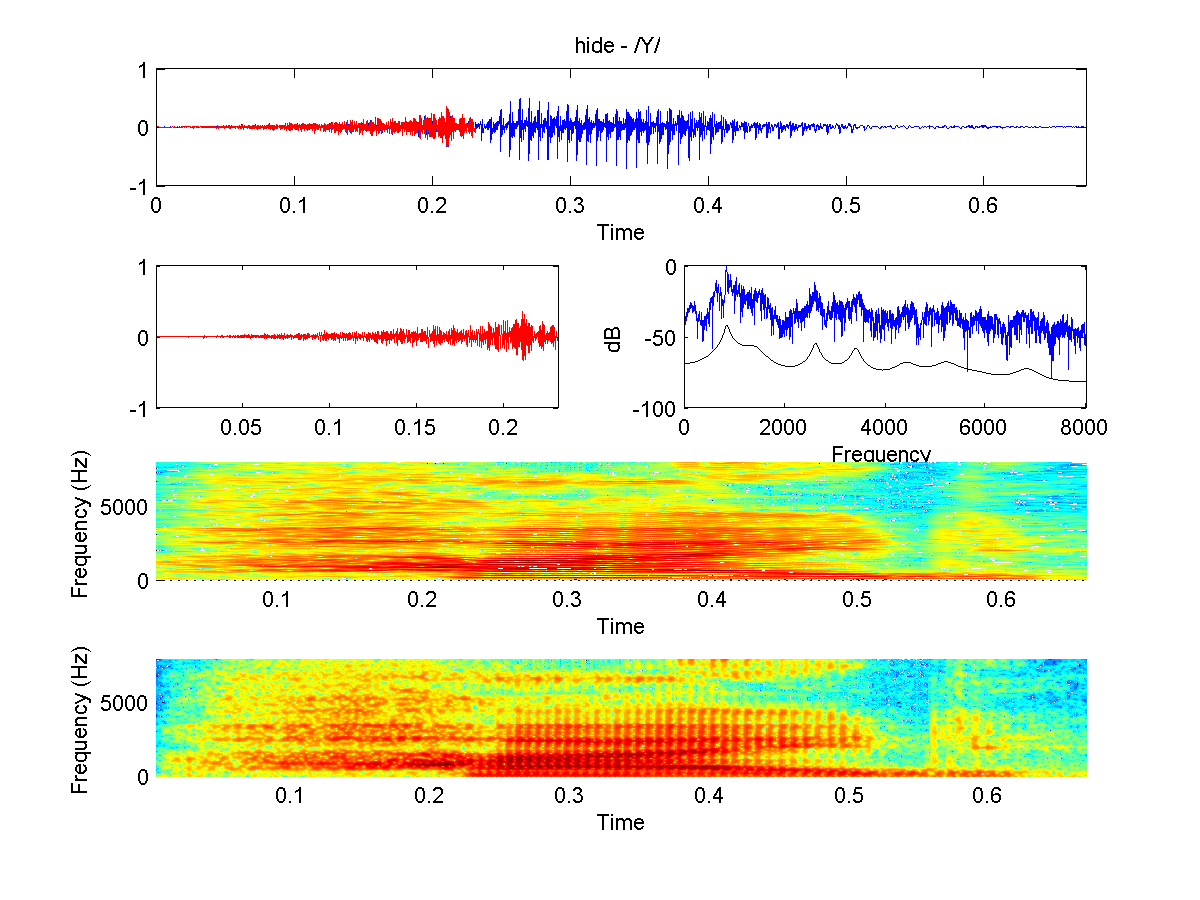
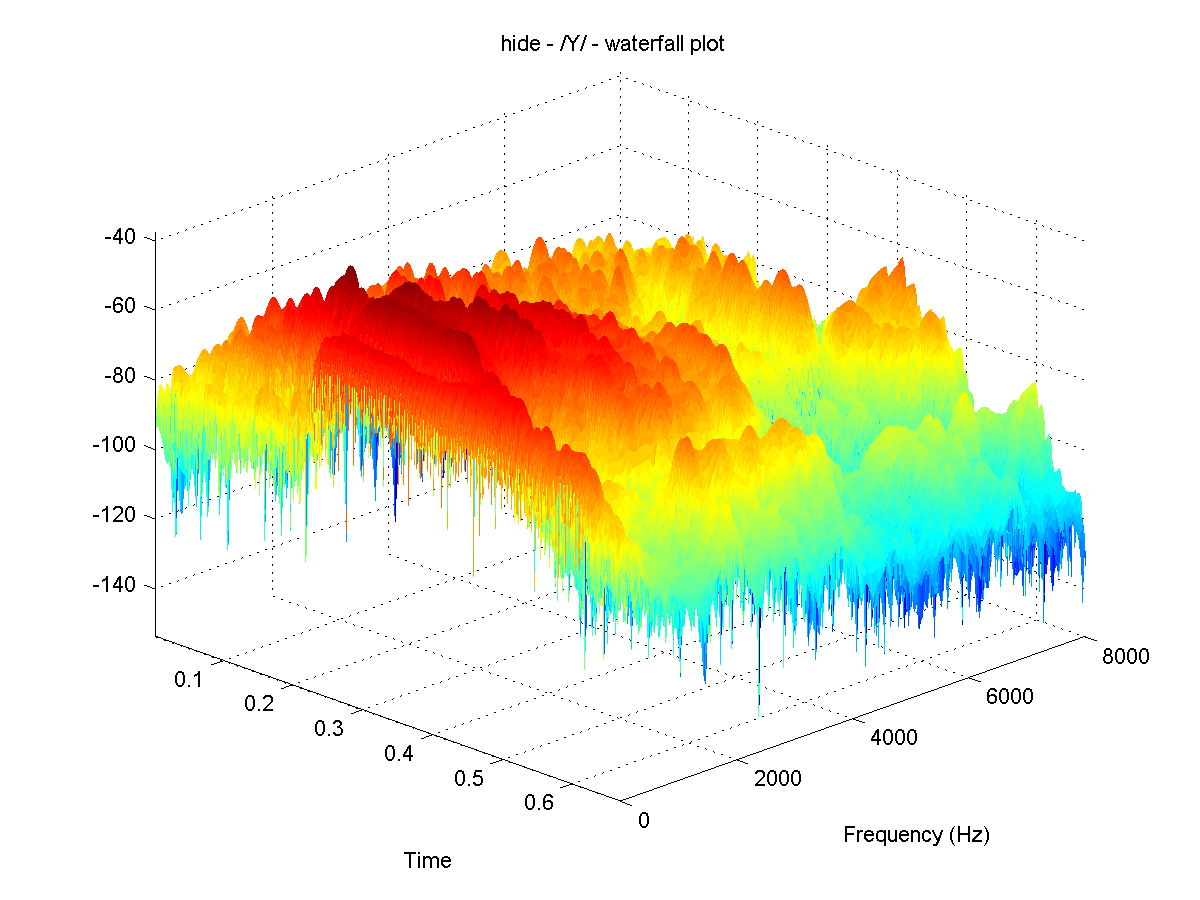
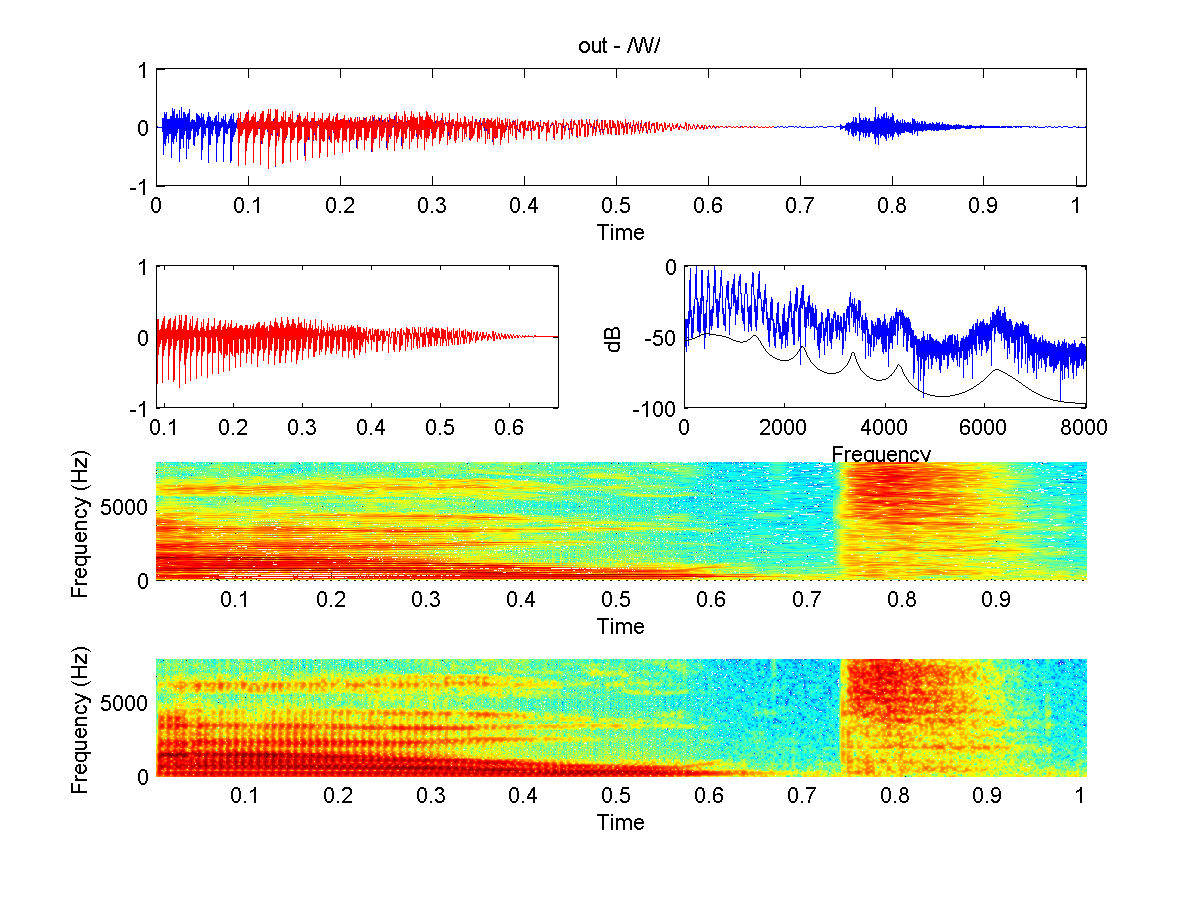
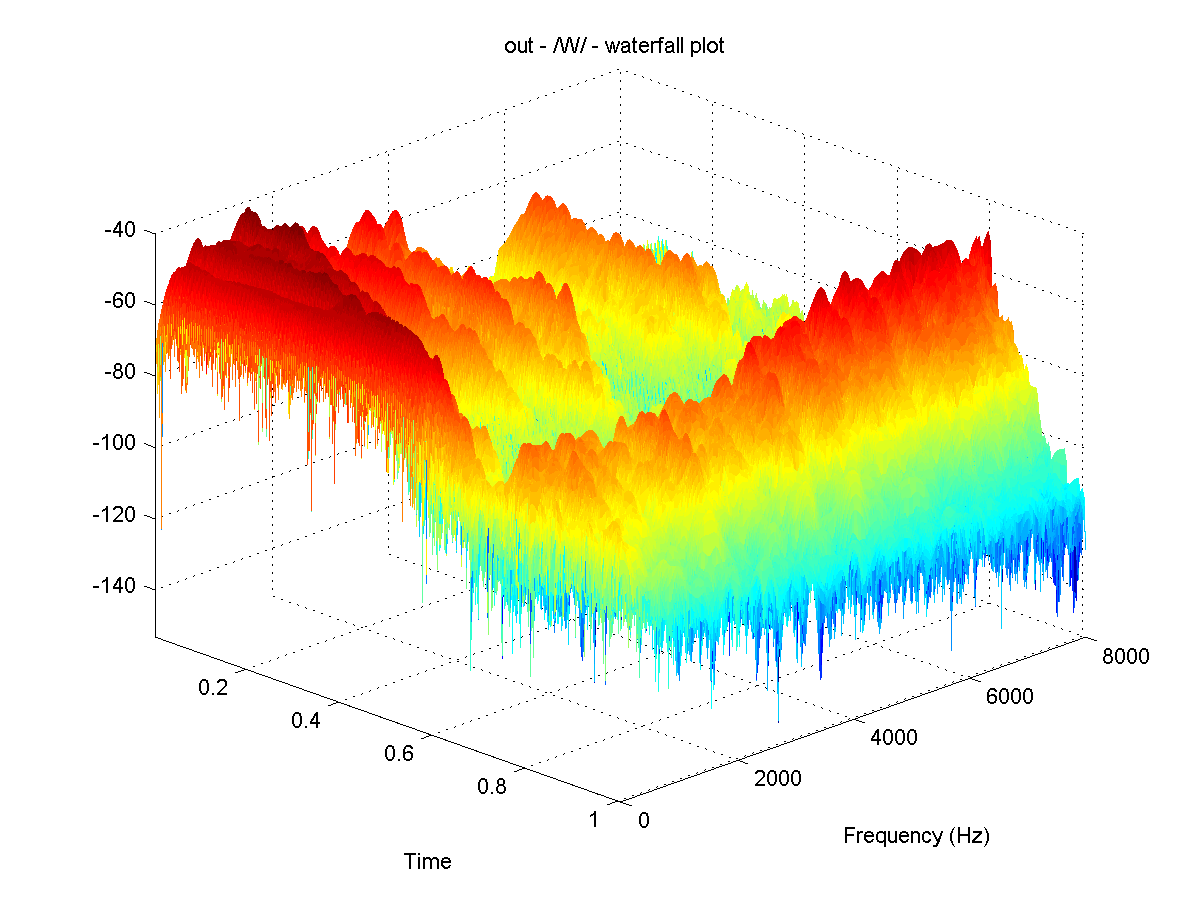
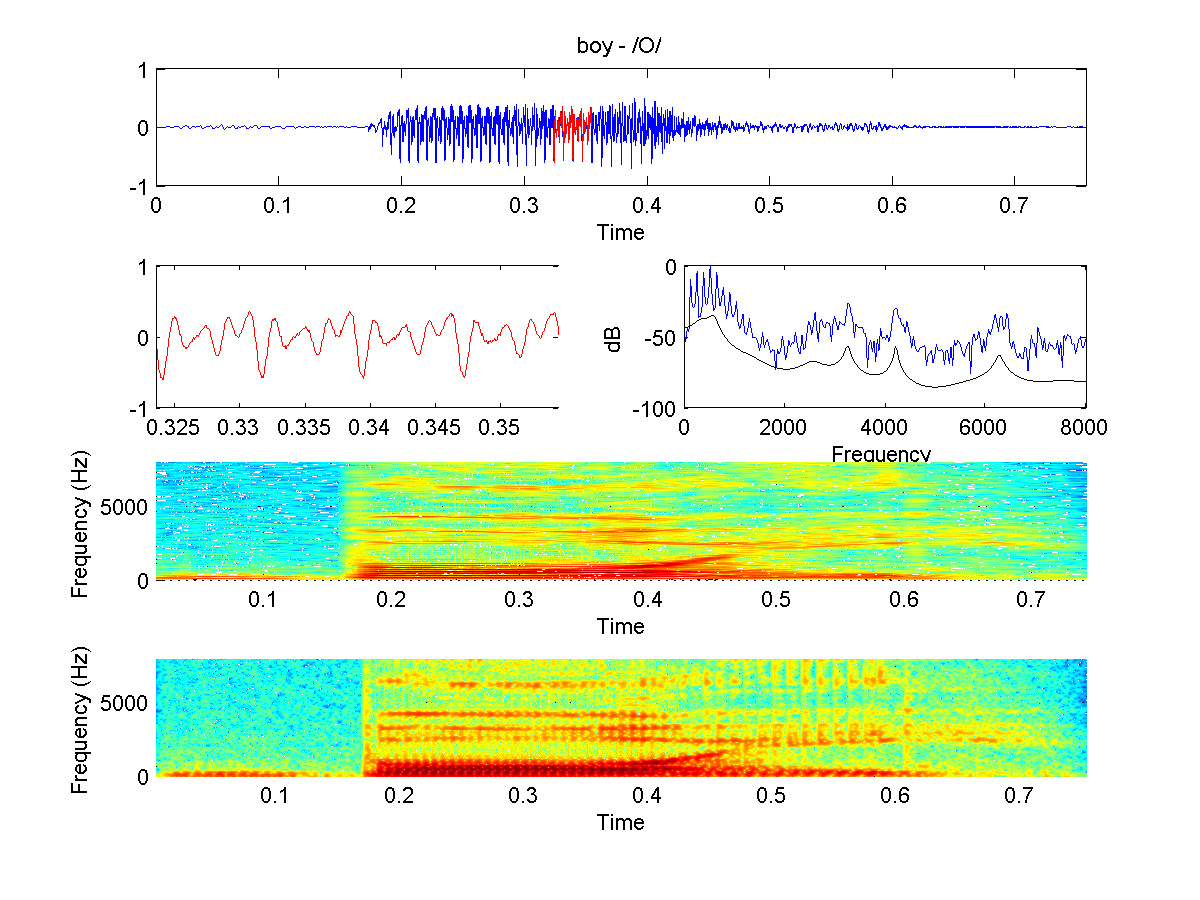
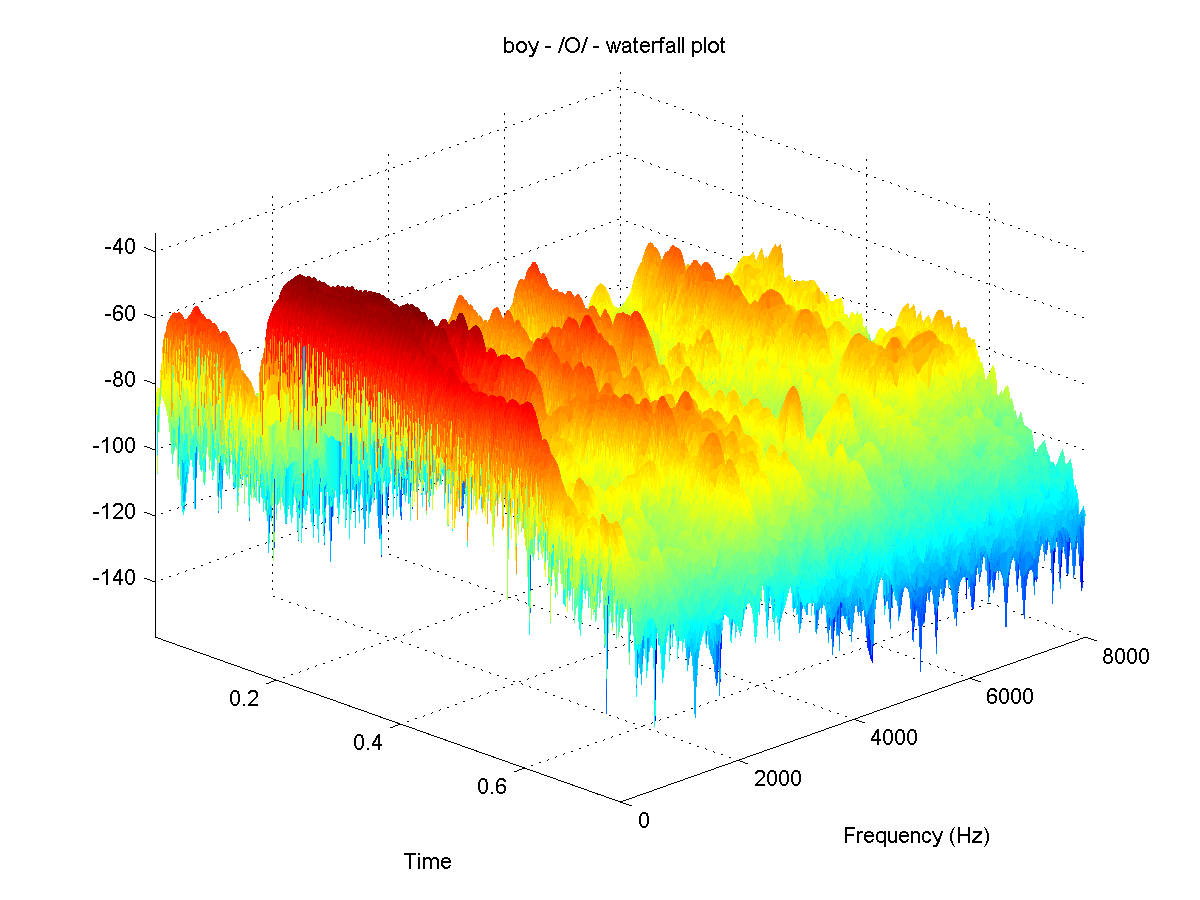
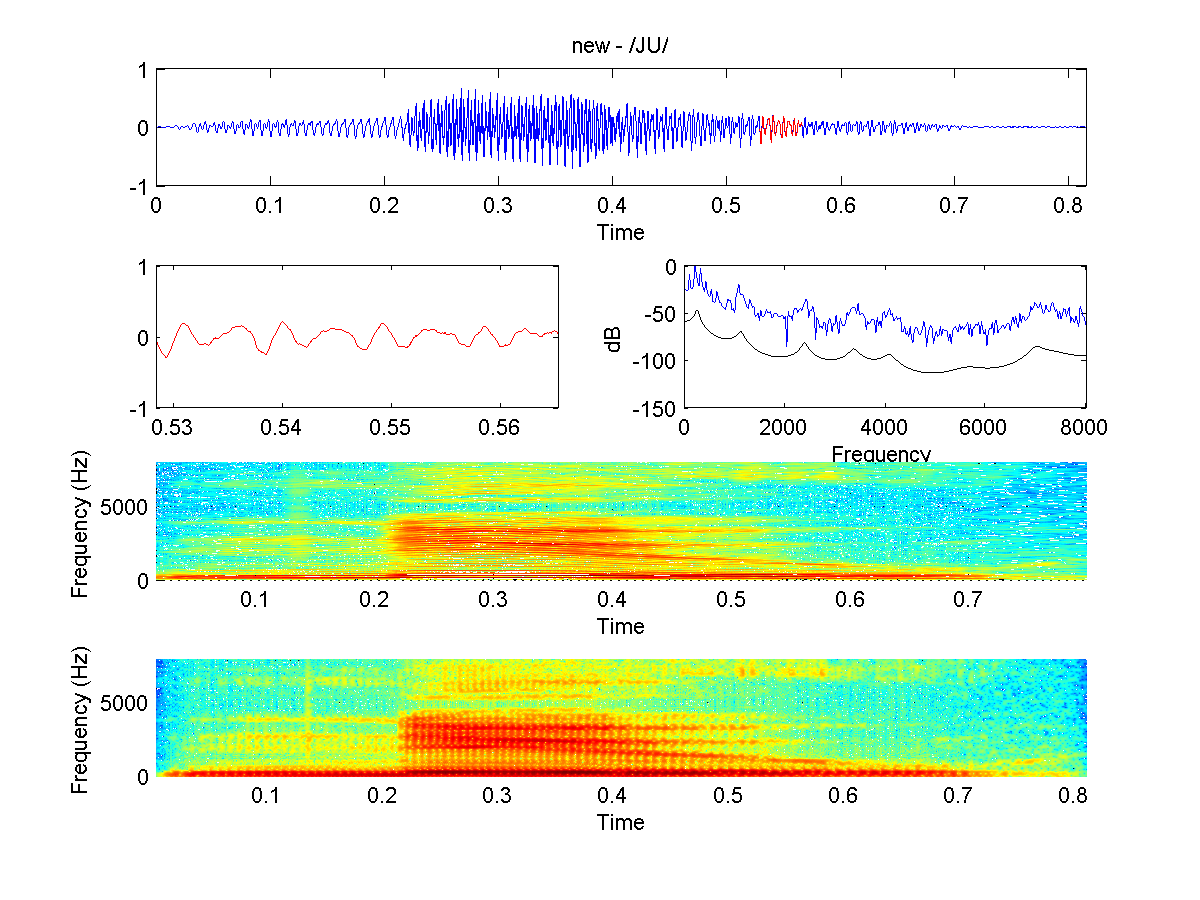
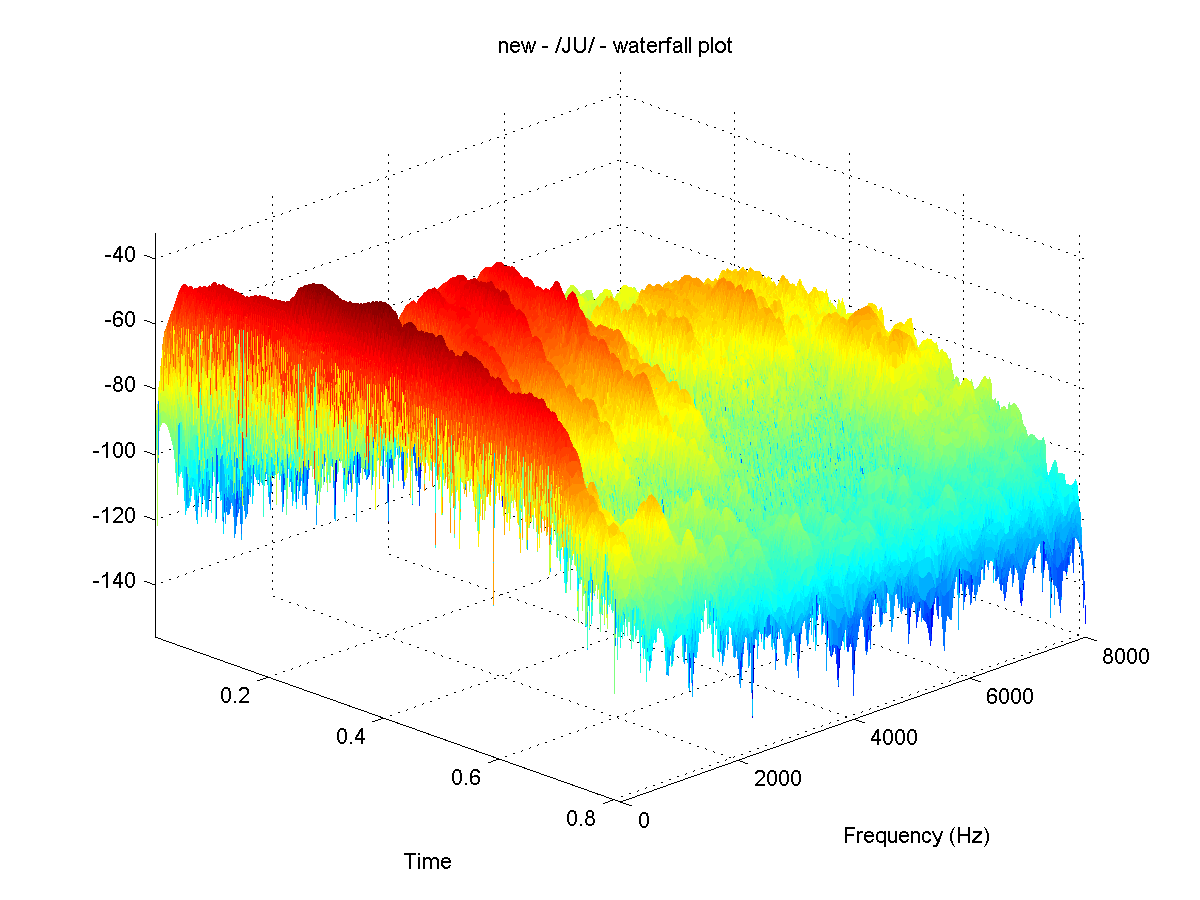
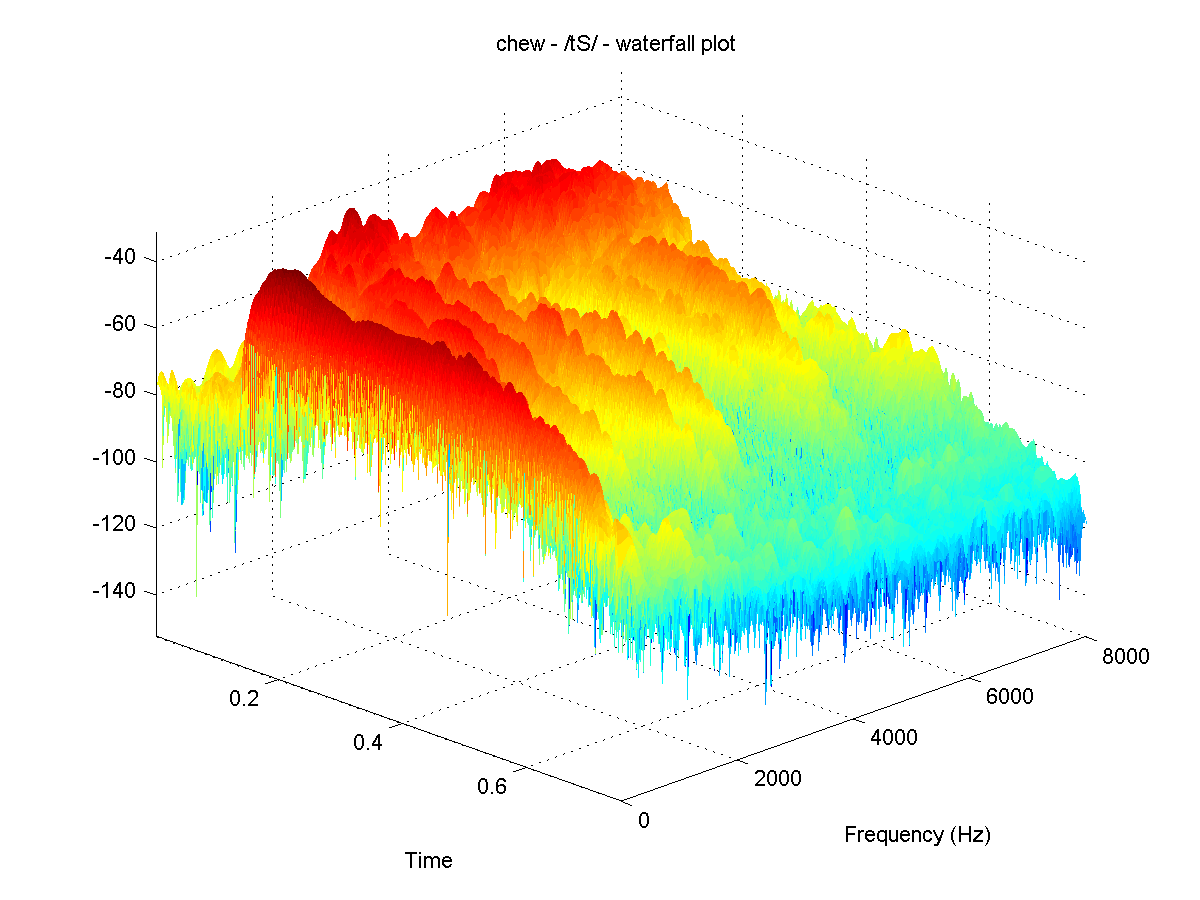
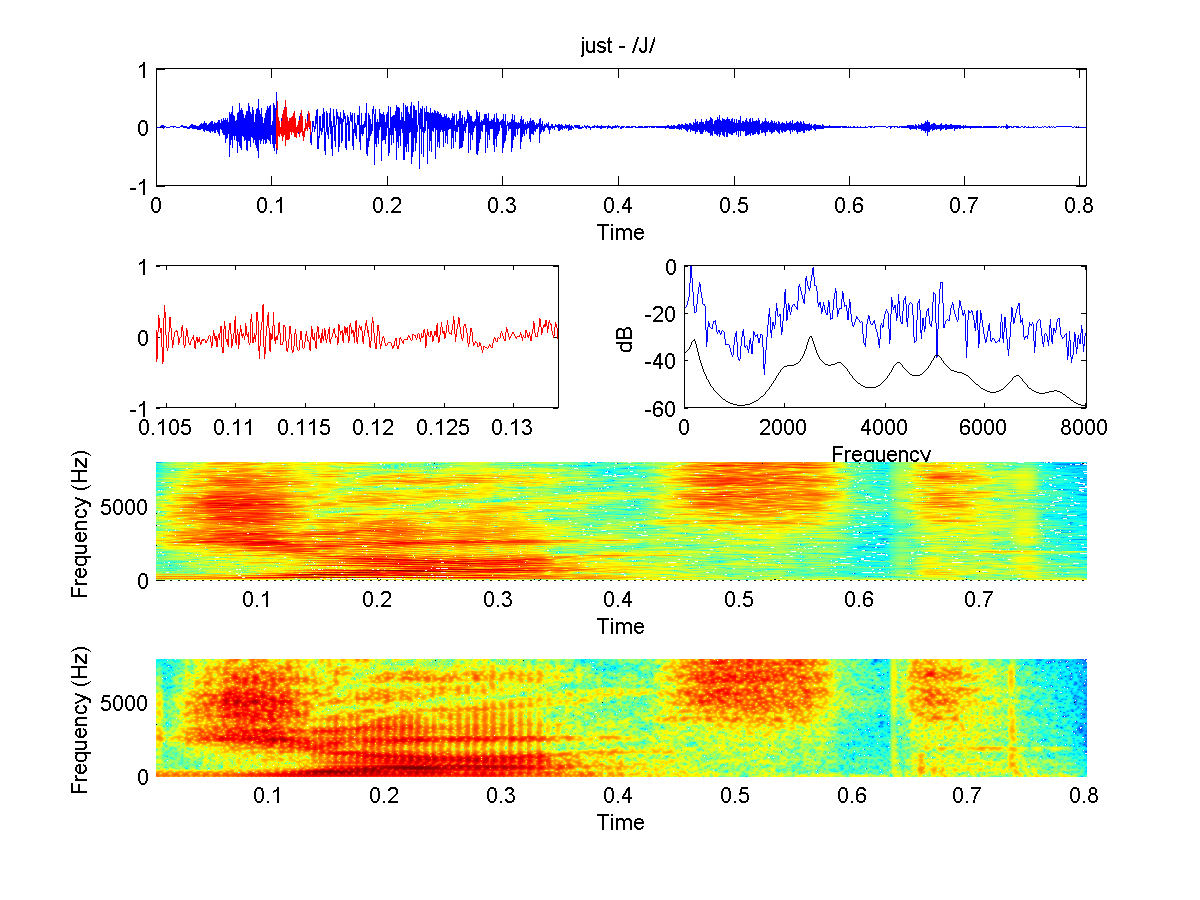
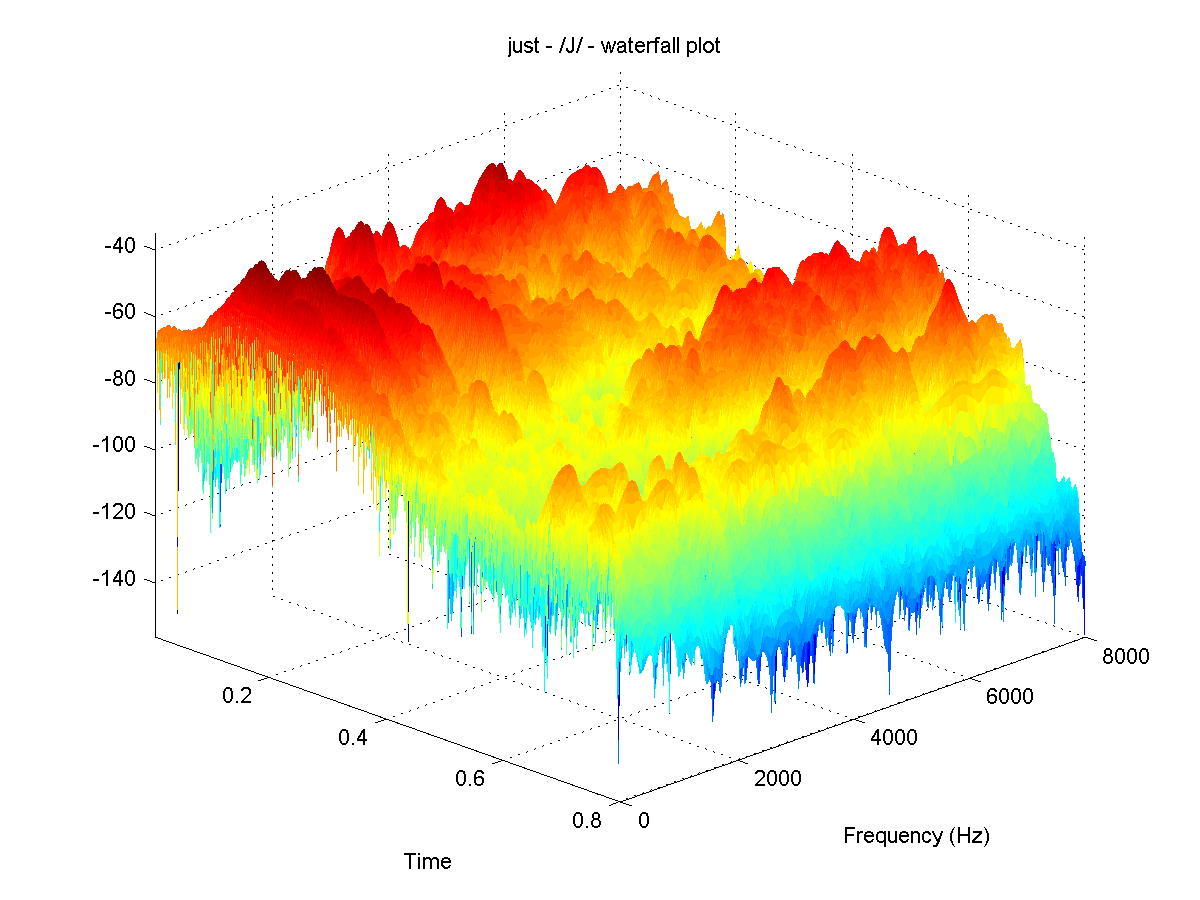
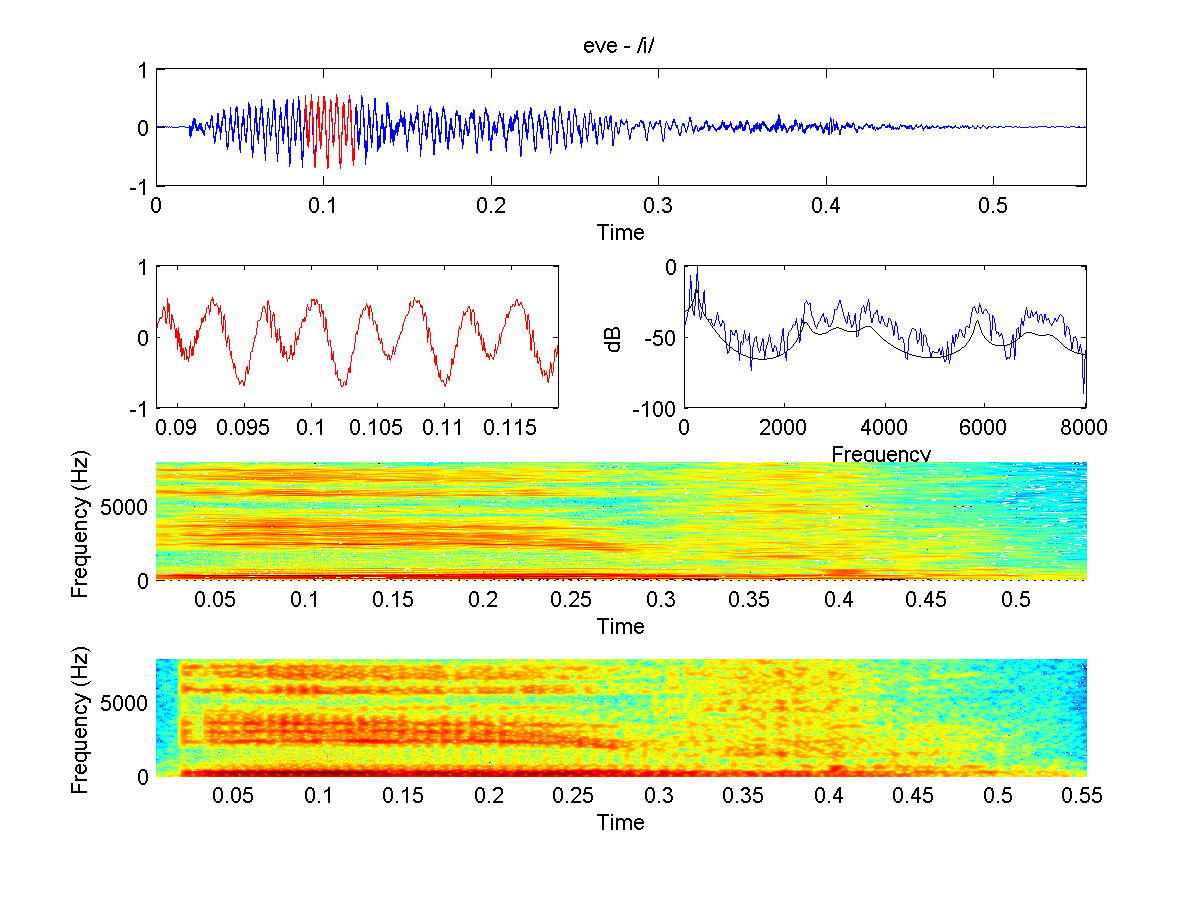
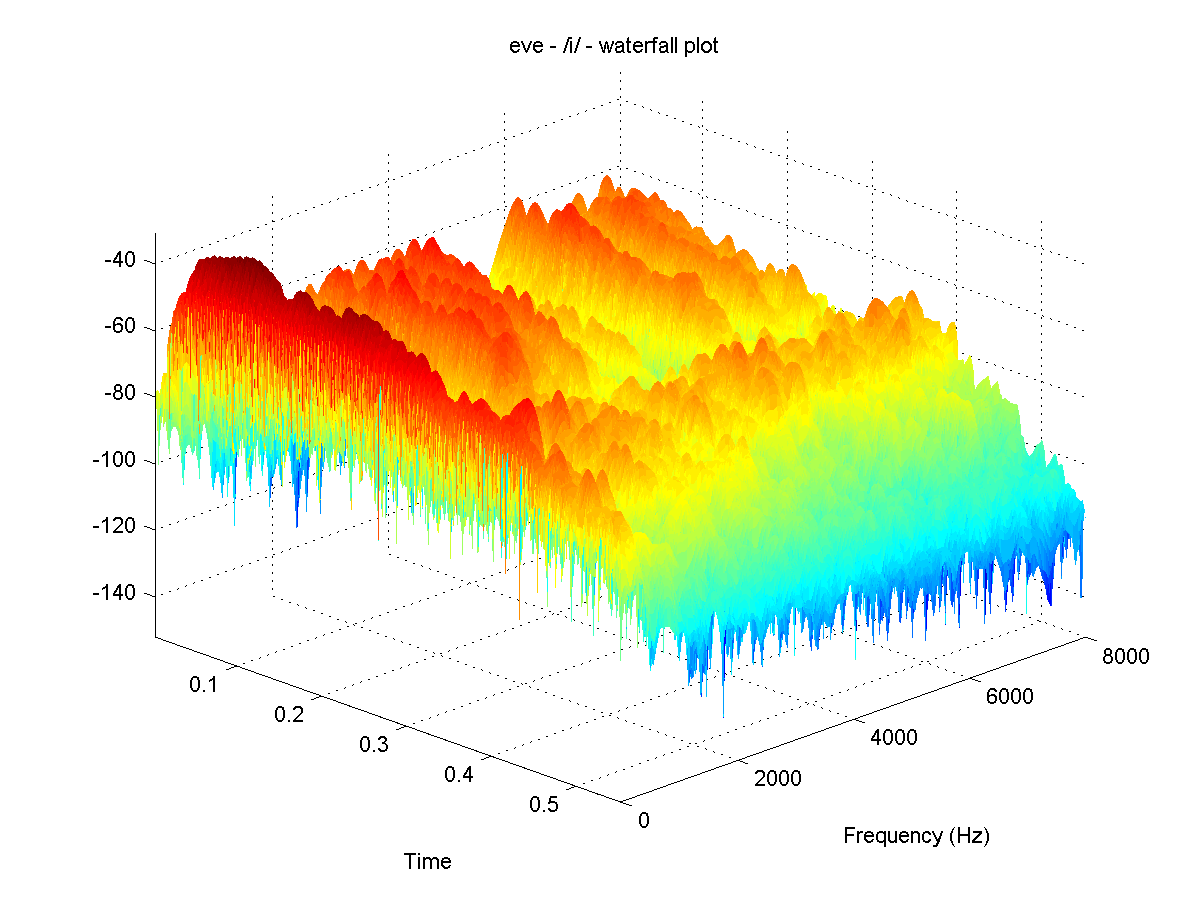
The magnitude spectrum and spectrogram plots of the words provide much insight about the differences between phonemes. The major characteristics that differentiate the phonemes are: harmonic content (how much is there), spectral shaping from formants, noise content, temporal characteristics of how the sound changes over time (such as whether it is impulsive).
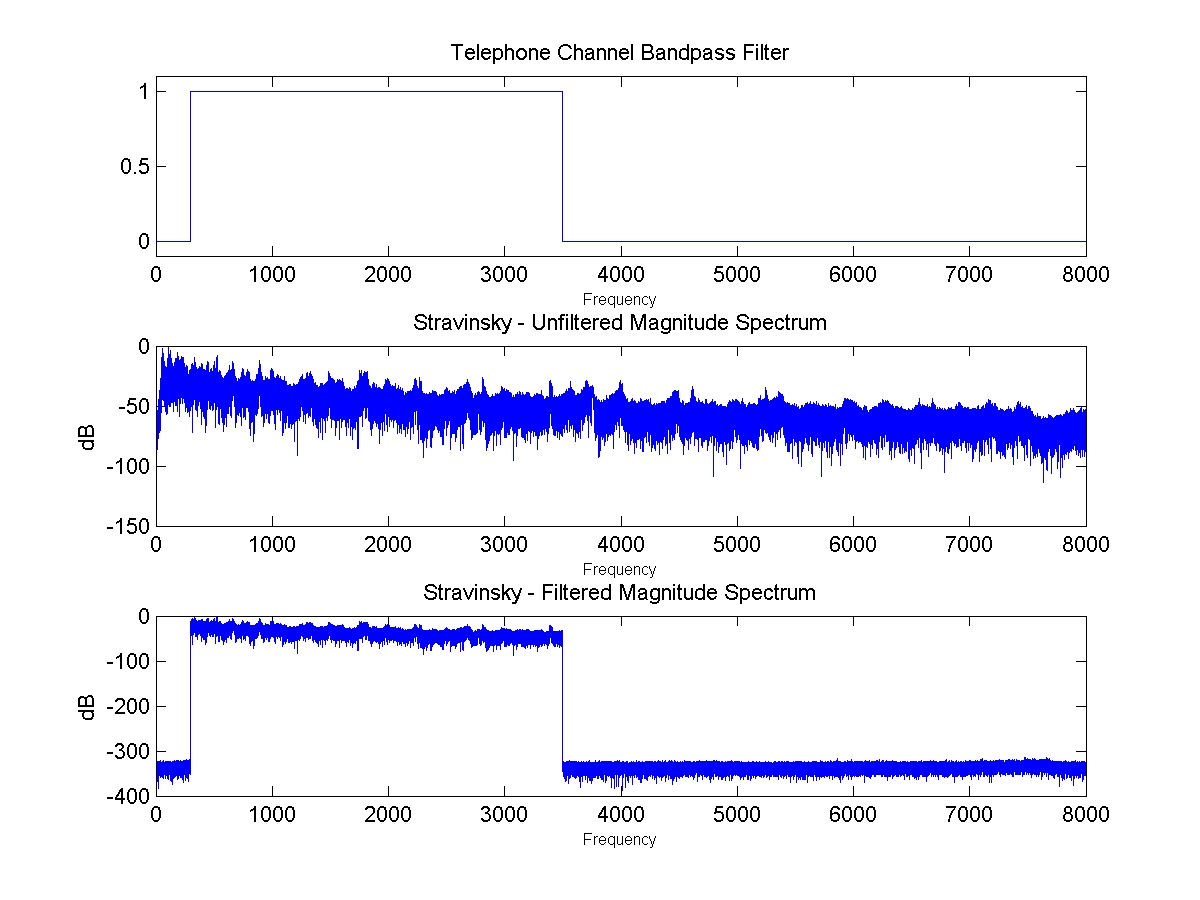
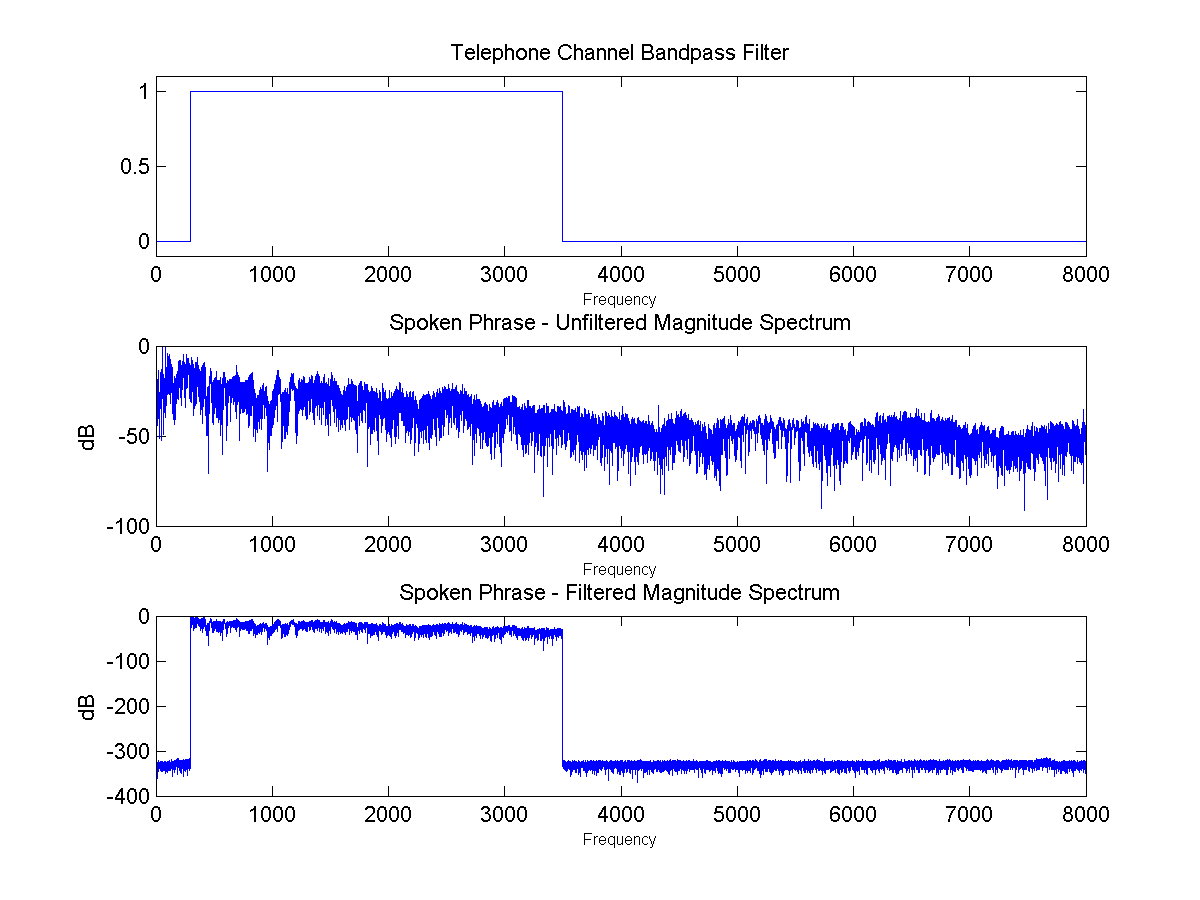
When the bandpass channel filter is applied, all frequency content above 3.5 kHz and below 350 Hz is lost. For some phonemes, this is more destructive than others. The fundamental frequency of the male speaking voice ranges from 80 to 250 Hz. This means that almost always, the first fundamental is lost over the phone. However, this does not significantly disturb the intelligibility of speech because the upper harmonic content remains and the human auditory system seems to fill in the missing fundamental.
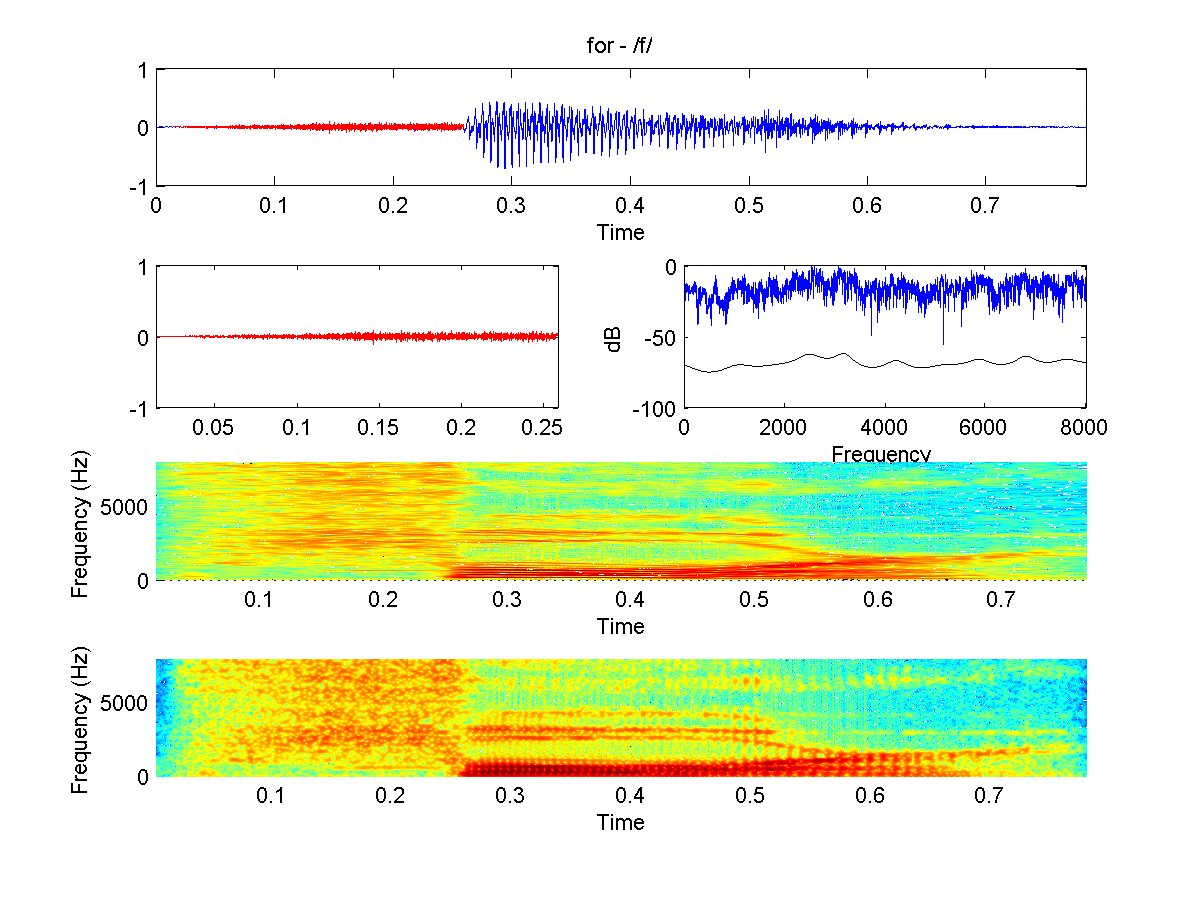
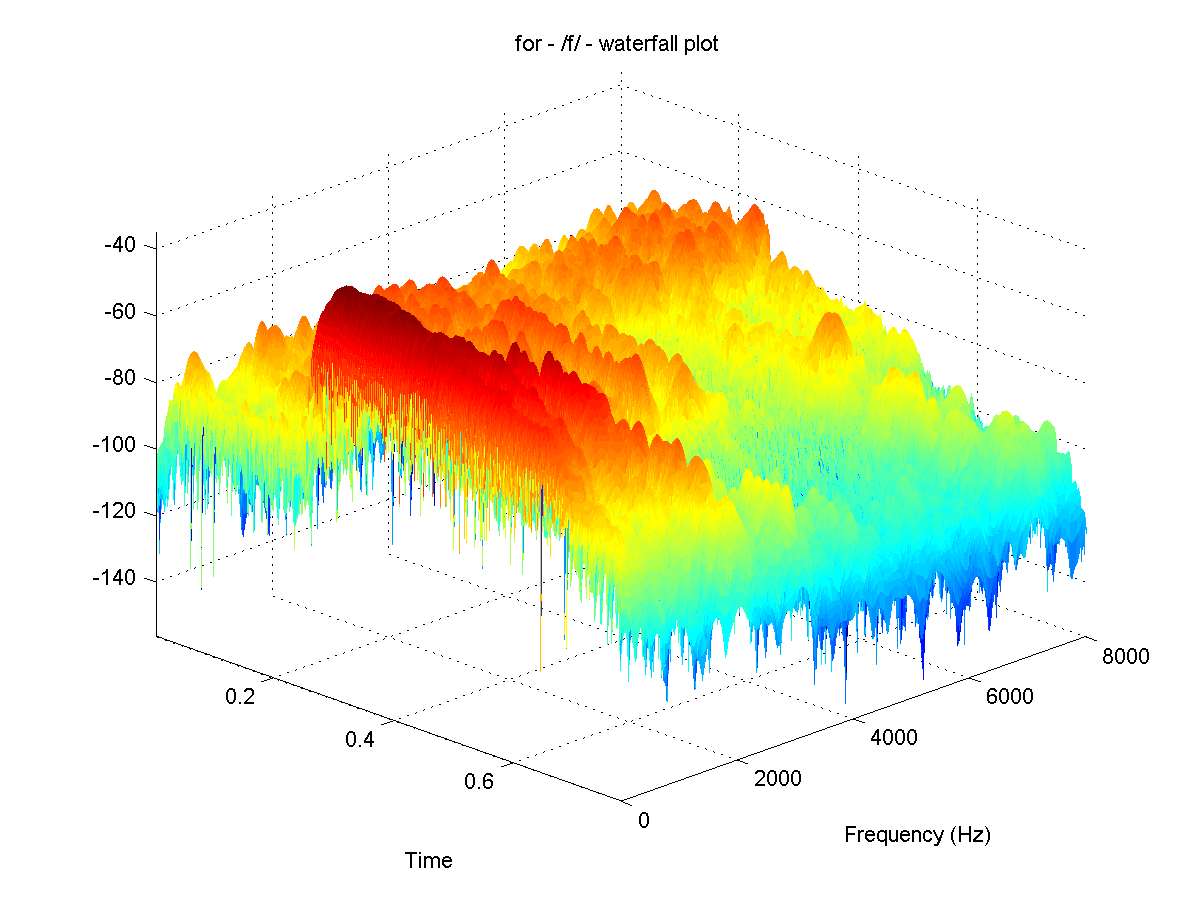
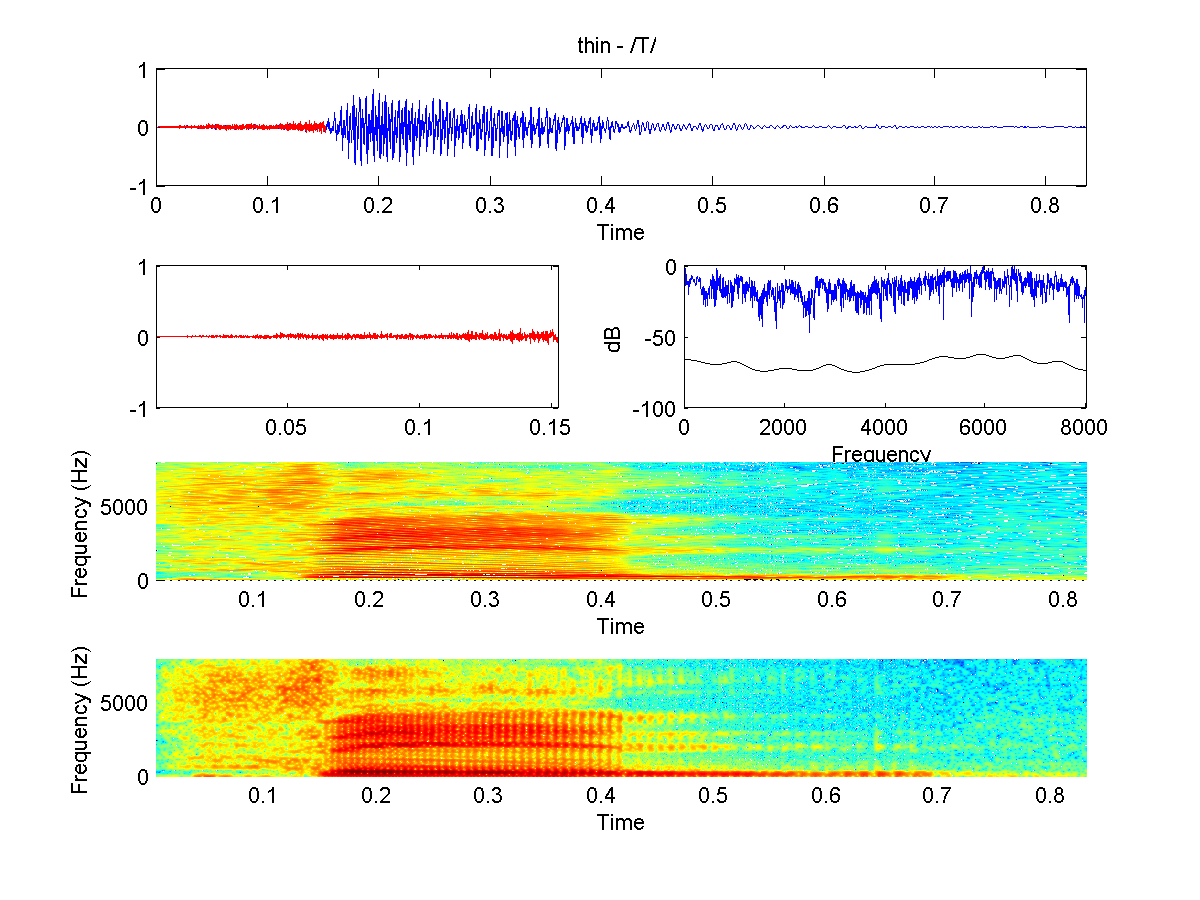
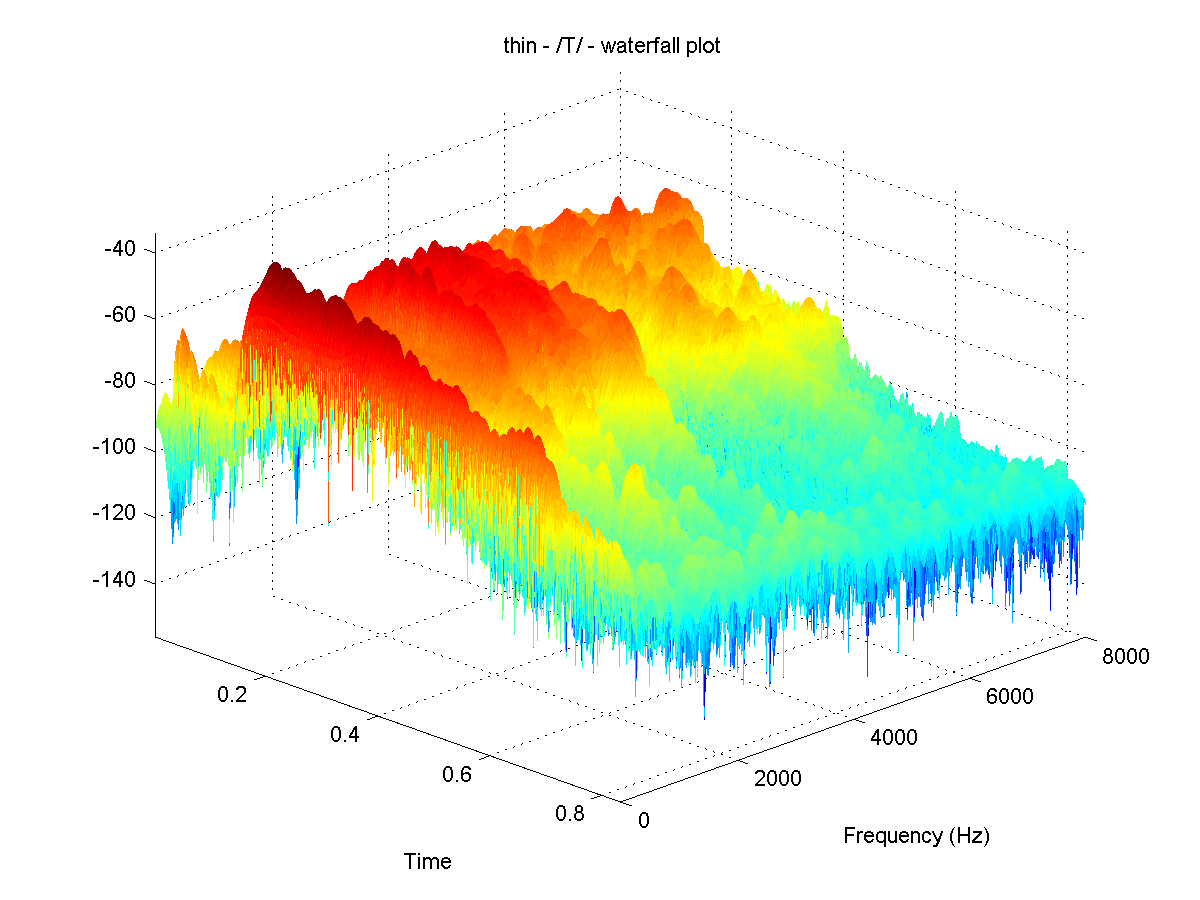
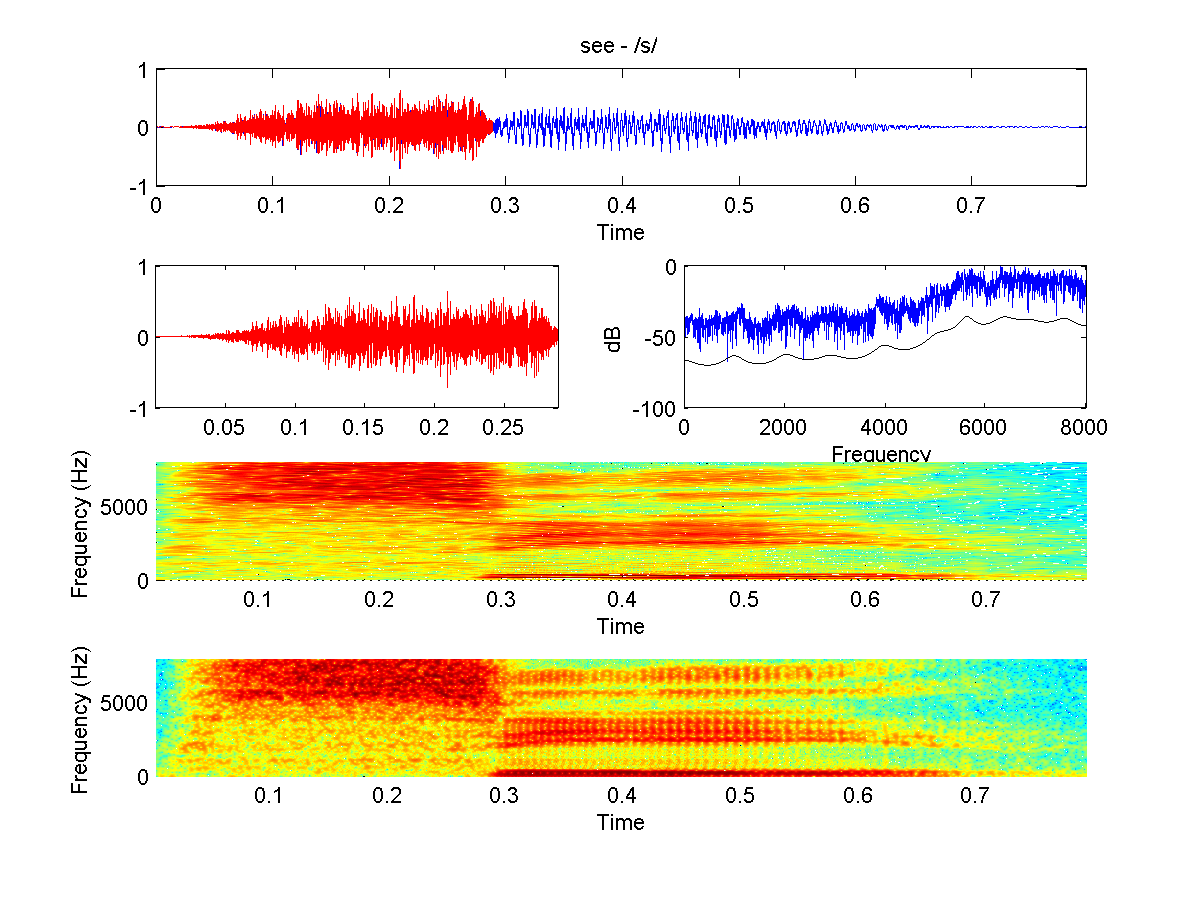
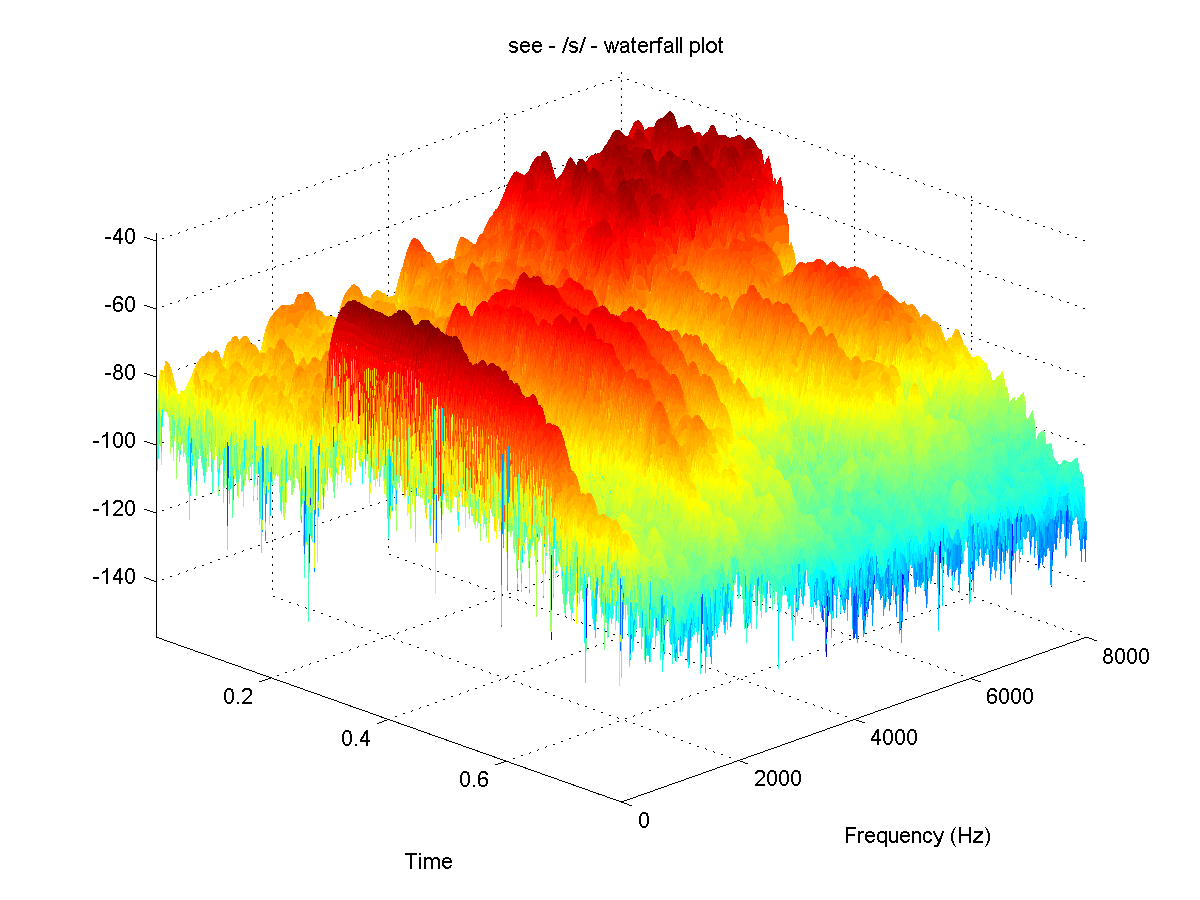
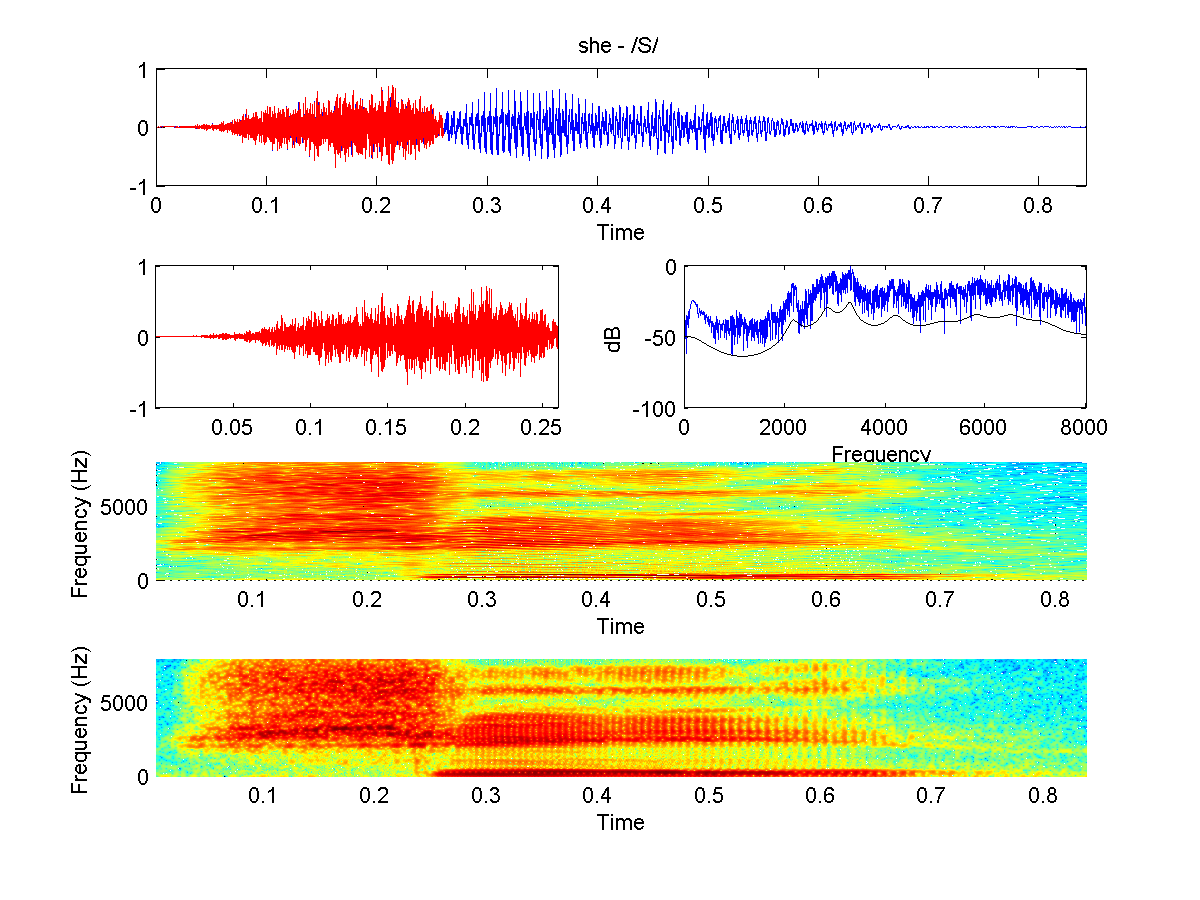
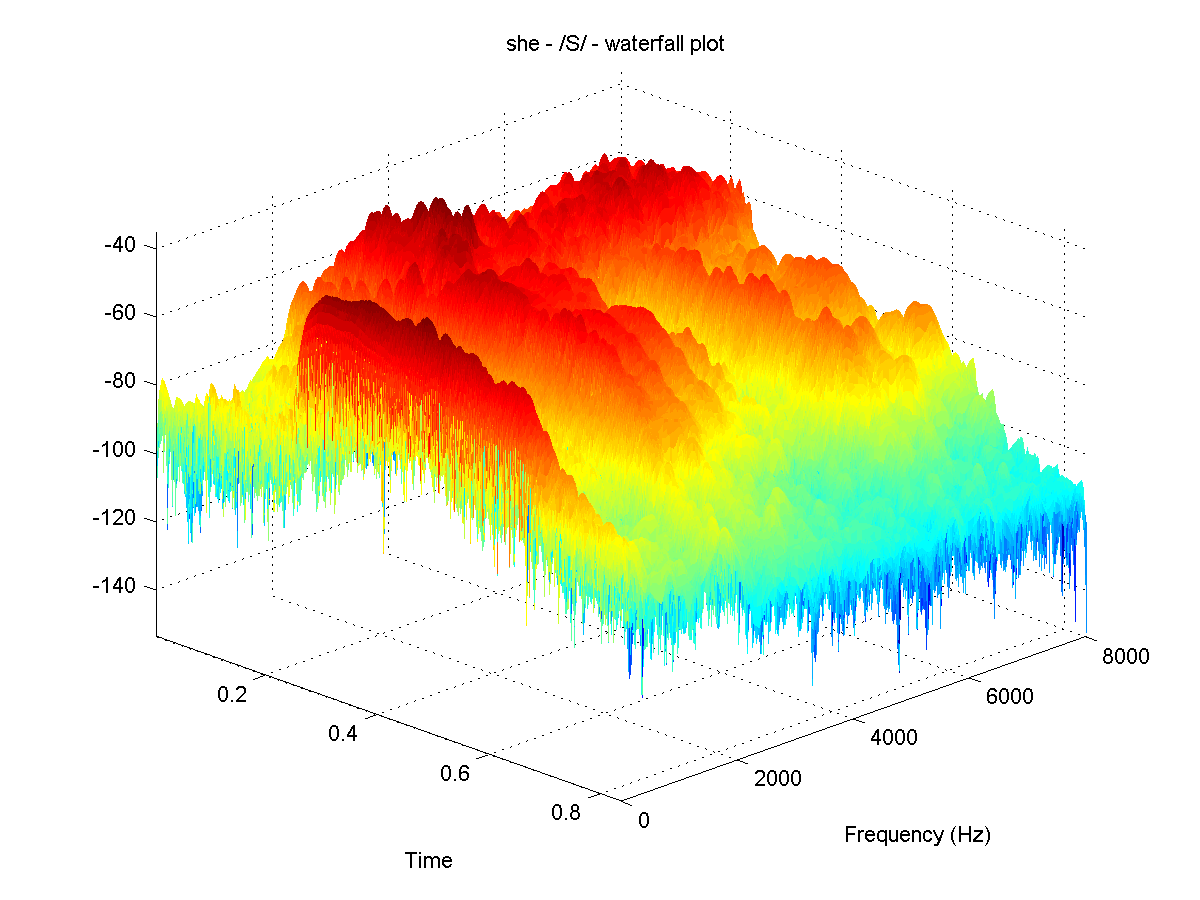
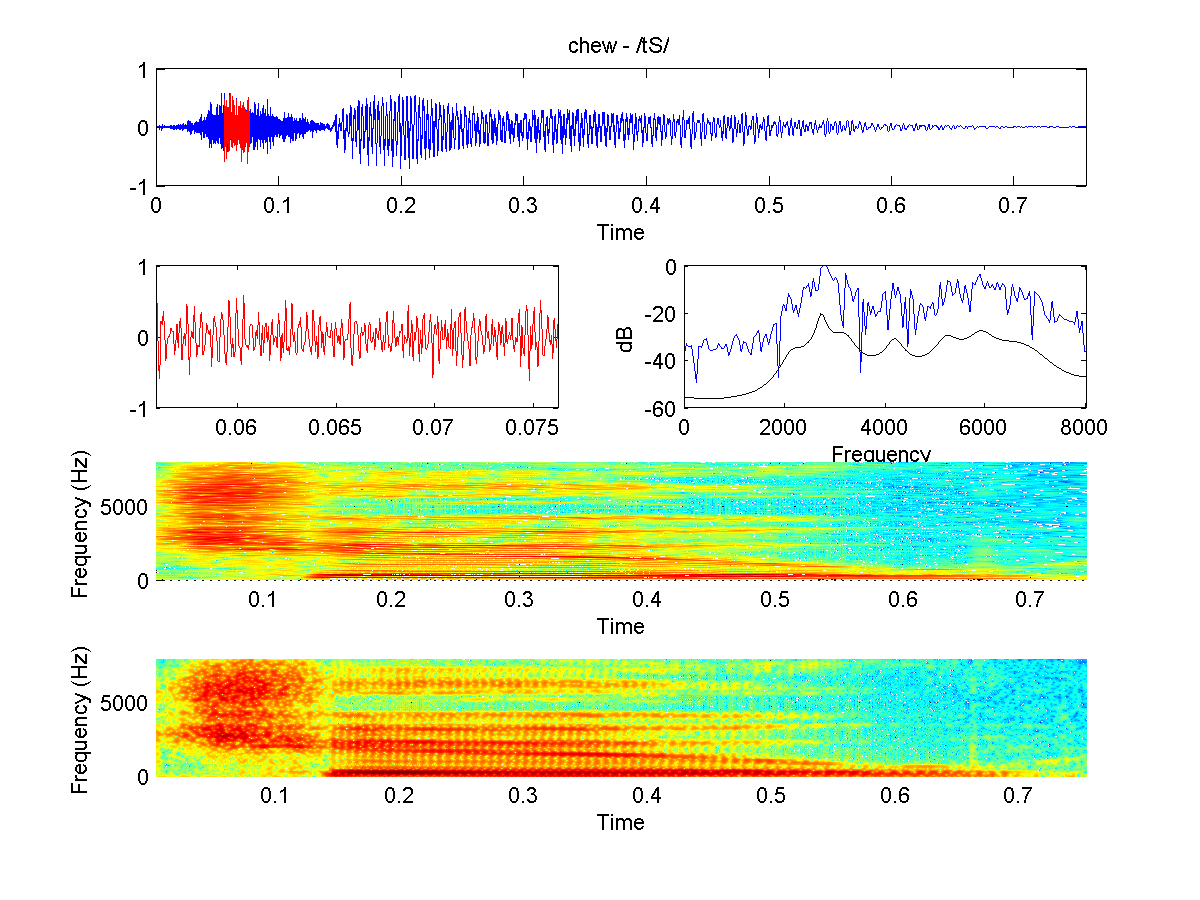
The fricatives and impulsive sounds with upper range frequency content suffer the most. In particular, the majority of the signal energy for the /s/ sound lies above 3500 Hz, so when the channel filter is applied, it is greatly attenuated and almost silenced. The two phonemes that may be confused the worst after filtering are perhaps the /f/ (as in for) and the /T/ (as in thin) sound.
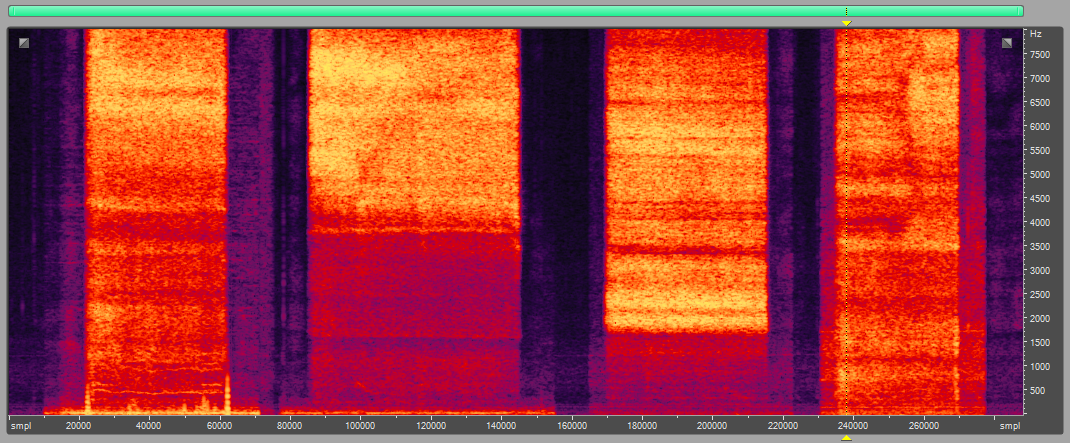
The spectrogram below shows the frequency content of the phonemes /f/ (as in for), /s/ (as in see), /S/ (as in she), and /T/ (as in thin). Time is displayed on the x-axis, frequency on the y-axis, and intensity is represented with color. You can see that the frequency content below 3500 Hz is nearly identical for the /f/ and /T/ phonemes, and almost lost for the /s/ phoneme.