
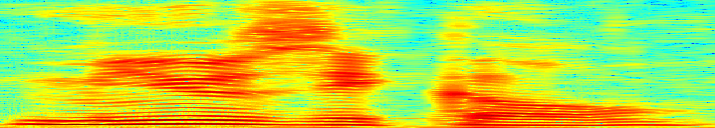
Spectrogram of water tube simulation.
Click to enlarge.
Input signal and final watery output of a tube being filled to the brim.
Implementation of this simulation is simple. The original noise signal is added to the inverted signal at a time-varying delay. The delay is fractional, linearly interpolated between neighboring samples.
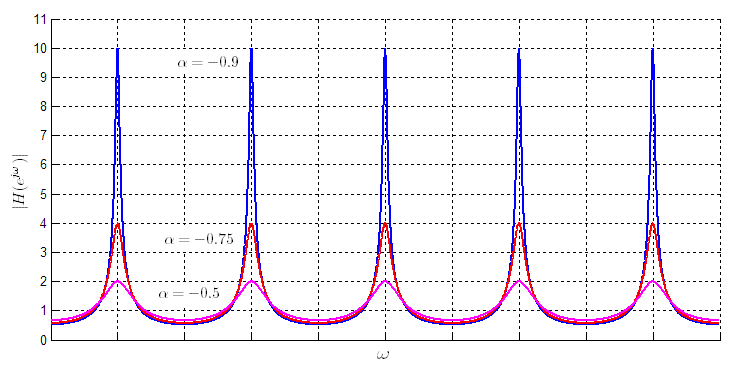 Small explanation: The mouth of a jar presents an impedance mismatch between the inside and outside air (since the air outside can be pushed around more freely), so it acts as a reflective surface. An acoustic wave emanating from the bottom of a bottle is reflected back toward the source, and again back toward the opening. The original signal is therefore duplicated with a small delay at the opening. This gives rise to a natural "flanger" effect as the comb filter peaks diverge to infinity at a delay of zero.
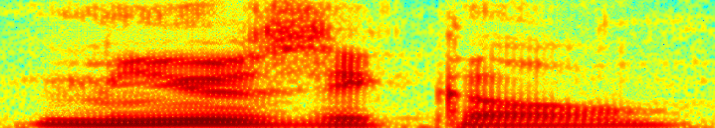
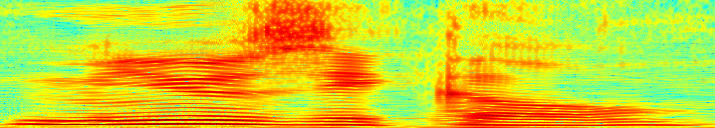
Progressively refined stages of spectrogram synthesis. The final result is a clear utterance of the word "musical."
The spectrogram was extracted from a PDF of the homework assignment. The spectrogram image dimensions were 715 x 128, with time on the x-axis (roughly 0.8 seconds) and frequency on the y-axis (a linear scale from 0 to 5512.5 Hz). Image manipulation was performed in Adobe Photoshop to prepare the image for spectrogram synthesis.
A wideband spectrogram was also extracted from the PDF.
The two spectrograms were combined using image processing techniques, a standard opacity blend, so that the upper frequency transient features in the wideband spectrogram could be joined with the lower frequency pitched features in the narrowband spectrum.
The spectrogram was then converted to a grayscale image using precise colormapping to reverse the MATLAB "Jet" color gradient to accurate values of gray.

Finally, the image was gamma corrected to reduce the gray levels, thus attenuating noisy pixel data.
The spectrogram was synthesized using the inverse FFT function of the FFTW library. Bin magnitude was set according to a direct mapping of grayscale value 0-255 => 0-1. Both direct sine and noisy synthesis were attempted. The sine synthesis method creates one sine tone for each 128 pixels in image height. The result is in an unpleasant metallic sound. This sound is due to the periodicity that arises when the phase of all sines remains deterministic throughout the output. The noise synthesis result sounds much better because it is as if many sine tones are generated for each pixel, and the phase is decorrelated in the result. It can also be thought of as a bandlimited noise signal at each bin.
© 2011 Matt Montag